Future climate
This section explains how global temperatures and precipitation are likely to change in the future based on projections known as “climate scenarios.”
Projecting future climate using climate scenarios
What are climate scenarios?
Projecting how future temperatures and rainfall patterns will change is not easy, since it depends on the kind of society we build, and the choices we make will determine the volume of our greenhouse gas emissions, which in turn affect future climate.
To project these various possible future climates, experts have developed greenhouse gas emission scenarios and socioeconomic scenarios that outline several plausible future pathways, based on different levels of fossil fuel dependence or pursuit of sustainability. Combinations of these scenarios are then used to develop climate scenarios that project multiple versions of our future climate. (For more on climate models, see How future climate is projected.) By comparing these climate scenarios with today’s climate, scientists estimate the extent to which temperatures and rainfall may change in the future.
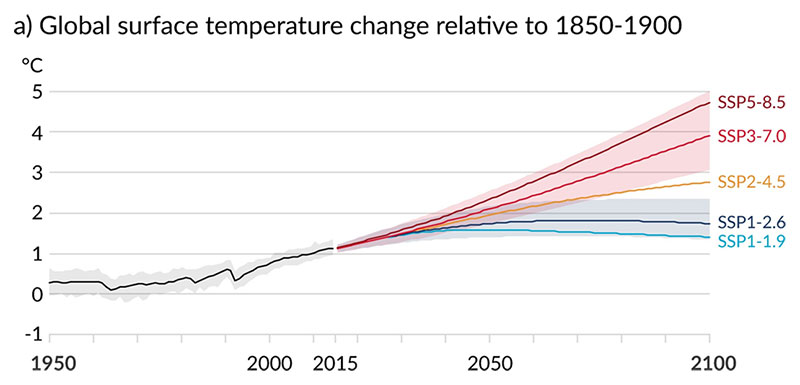
Global surface temperature changes in °C relative to 1850–1900. (IPCC AR6 WGI-Figure SPM.8; IPCC, 2021) These changes were obtained by combining CMIP6 model simulations with observational constraints based on past simulated warming, as well as an updated assessment of equilibrium climate sensitivity. Changes relative to 1850–1900 based on 20-year averaging periods are calculated by adding 0.85 °C (the observed global surface temperature increase from 1850–1900 to 1995–2014) to simulated changes relative to 1995–2014. Very likely ranges (shading) are shown for SSP1-2.6 and SSP3-7.0.
Projected Global Mean Temperature Relative to the 1850–1900 Baseline
IPCC AR6 WGI-Figure SPM.8; IPCC, 2021
Future climate projections using climate scenarios
Global projections
Projections of the world’s future climate are provided in assessment reports published periodically by the IPCC. (For further information on the IPCC, see IPCC.)
This section presents the projections published in the IPCC Sixth Assessment Report (AR6). This report projects future climate based on five different scenarios that combine assumptions about future socioeconomic development with corresponding greenhouse gas emission levels.
For example, under the SSP5-8.5 scenario, which assumes a fossil-fuel-dependent world with little effort to reduce emissions, the global average temperature in 2100 is projected to rise by about 4.4 °C compared to pre-industrial levels. In contrast, under the SSP1-1.9 scenario, which envisions sustainable development and achieving net-zero CO2 emissions around 2050, the temperature rise is projected to remain below 1.5 °C. (For details on the SSP scenarios, see How future climate is projected.)
Temperature rise
Continued greenhouse gas emissions could lead to a global average temperature rise of up to about 4.4 °C compared to the 1850–1900 average, but this warming will not be uniform across the globe; there will be significant regional differences.
Looking at the world as a whole, high-latitude regions—especially those near the Arctic such as northern North America and northern Eurasia—are warming much faster than low-latitude regions. The maps below show these areas in darker colors, indicating a larger magnitude of change. Temperatures in these regions are projected to rise at twice the speed of the global average.
Moreover, land surfaces are warming more rapidly than ocean surfaces, with land surface temperature increases projected to be about 1.4 to 1.7 times greater than those over the ocean.
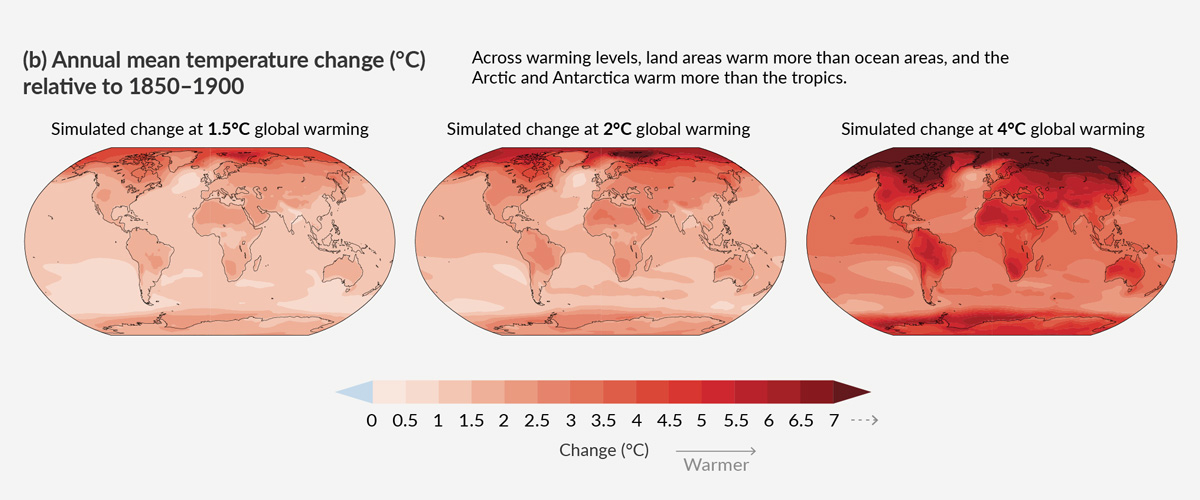
IPCC AR6 WGI-Figure SPM.5; IPCC, 2021
Changes in precipitation and other factors
The annual maximum daily precipitation (the heaviest rainfall in a single day) is projected to increase in areas near the poles, the equatorial Pacific, and the Middle East/India, and to decrease in parts of Central and South America, South Africa, and elsewhere.
Note, however, that the maps show the rate of change (percentage increase or decrease). In regions with naturally low rainfall like the Sahara Desert in North Africa, even a small absolute change in precipitation can result in a very large percentage change.
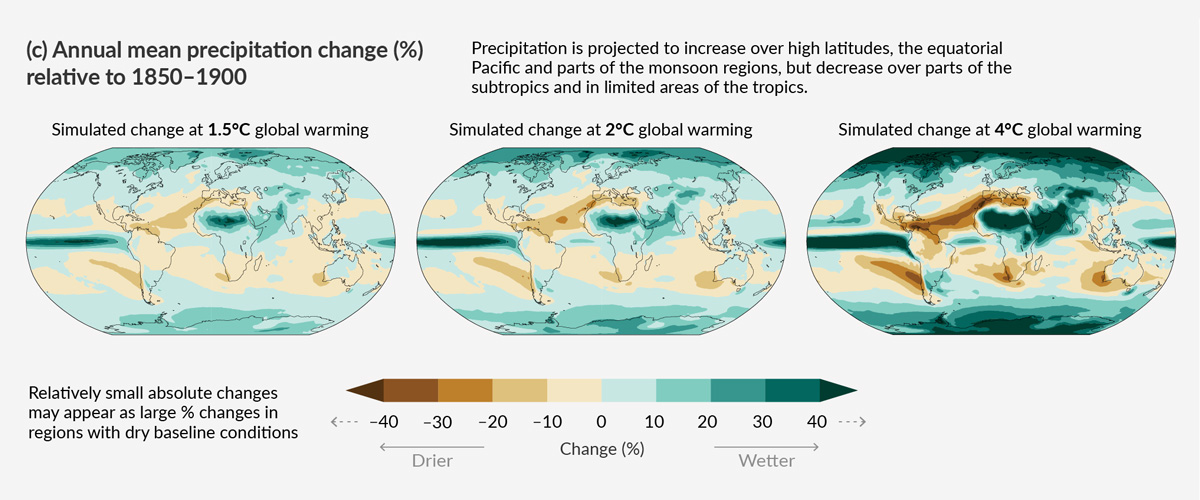
IPCC AR6 WGI-Figure SPM.5; IPCC, 2021