/ Total
National Institute for Environmental Studies (NIES), Japan
ClimoCast is a climate projection tool that shows climate projections up to the year 2100 in four representative greenhouse gas emissions scenarios (SSP126 - 585) and ten major climate simulation models. The tool covers all countries and allows users to compare different scenarios and models, as well as downscale the results to sub-national level. Climate data can be downloaded in CSV format.
National Institute for Environmental Studies (NIES), Japan
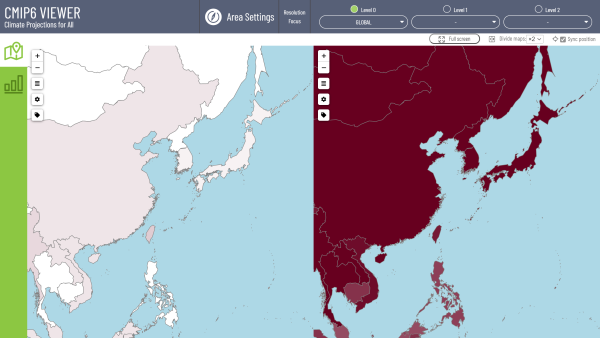
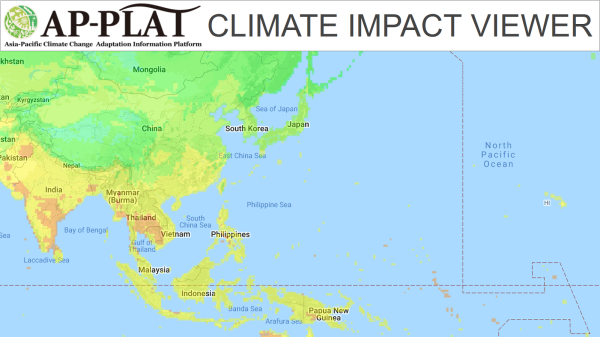
Climate Impact Viewer shows the results of a climate change impact assessment based on the Integrated Climate Assessment - Risks, Uncertainties and Society (ICA-RUS) and Comprehensive Research on the Development of Global Climate Change Risk Management Strategies (S-10 Strategic Research Project) supported by the Environment Research and Technology Development Fund of the Ministry of the Environment of Japan. Process-based impact models for multiple sectors were used for future influence projections.
National Institute for Environmental Studies (NIES), Japan
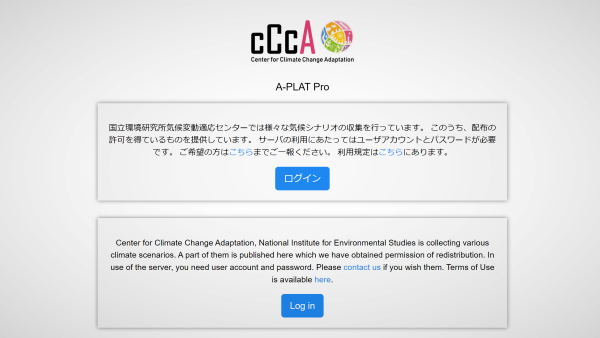
A-PLAT Pro is a collection of various climate scenarios. Datasets include CMIP3, CMIP5, ISIMIP, d4PDF at a global scale and down-scaled data in Japan. Data can be downloaded, viewed as a time series or a map, or otherwise analyzed. A-PLAT Pro is managed by the Center for Climate Change Adaptation (CCCA) at NIES. Part of the data collected by CCCA, for which CCCA obtained permission of redistribution, is published here. Please contact CCCA if you wish to obtain user ID and password to access the data. Since some technical knowledge is necessary to handle the datasets, A-PLAT Pro is intended for technical users rather than general public.
C40
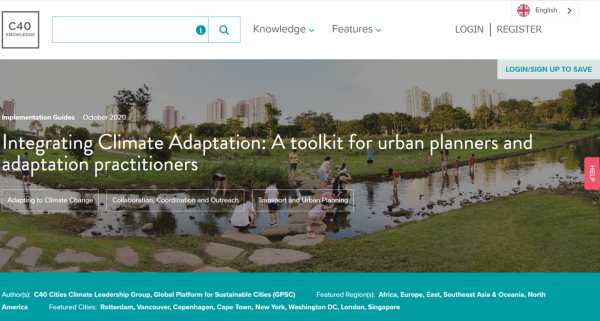
This toolkit is aimed at urban planners and climate adaptation specialists working for cities and guides integrating climate adaptation into urban planning. It is a PDF document written in English, French, Portuguese, and Spanish. The toolkit provides ways to adapt to flooding, heat, drought, sea level rise, storms, and wildfires and also provides an overview of urban planning policies that can be used to adapt to climate change. It also offers approaches for organizing in-person or virtual workshops where city planning and adaptation staff can come together.
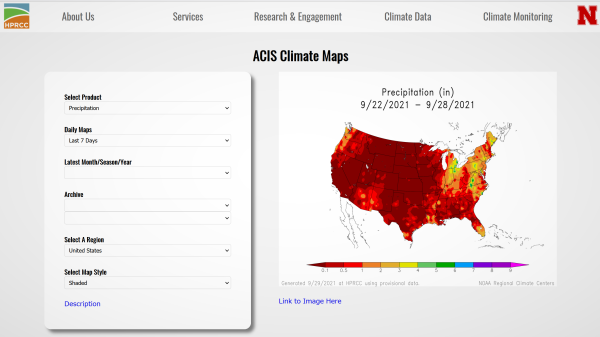
High Plains Regional Climate Center (HPRCC)
ACIS Climate Maps are a collection of temperature and precipitation maps across the USA. The following data are available: precipitation (absolute, departure from normal, and percent of normal), Standardized Precipitation Index (SPI); temperature (absolute, departure from normal, average maximum and minimum, etc); cooling degree days and heating degree days (absolute and departure from normal). Users can select a specific US region or states for more spatially detailed map, and choose from various timescales. Displayed maps can be downloaded as image files. Data can also be downloaded from the HPRCC GIS Portal, allowing users to create their own custom maps.
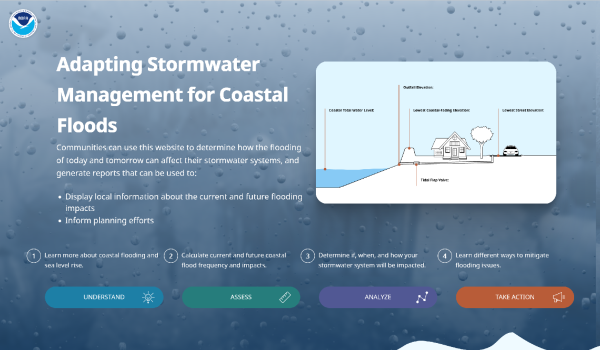
National Oceanic and Atmospheric Administration (NOAA)
This tool allows users in USA to learn more about coastal flooding and sea level rise, calculate current and future coastal flood frequency and impacts, determine if, when, and how the stormwater system in the user's community will be impacted, and learn different ways to mitigate flooding issues.
University of Tokyo, Pacific-Consultants Co., LTD., Ministry of the Environment, Japan
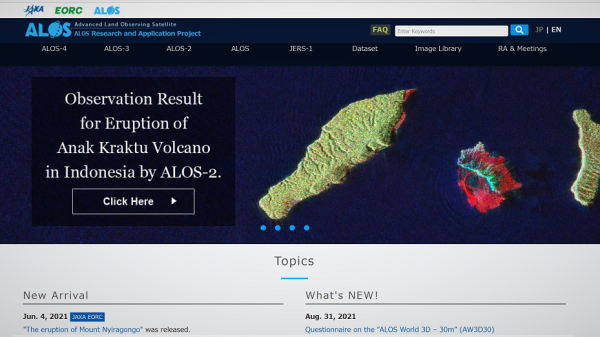
Japan Aerospace Exploration Agency (JAXA), EORC
Altitude maps Digital Surface Model (DSMs) can be displayed based on JAXA provided satellites (ALOS) images. It is possible to grasp the outline of the topography in the vicinity of the target land. It can be used to investigate exposure to hazards and vulnerabilities.
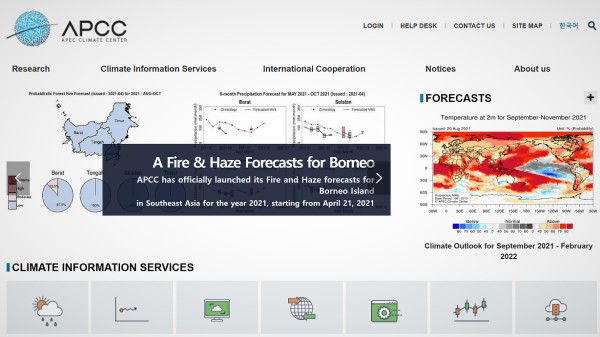
Asia-Pacific Economic Cooperation (APEC)
APCC (APEC Climate Center) provides a variety of climate information services, including Seasonal Forecast (6-month climate outlooks, updated monthly), BSISO Forecast (Boreal Summer Intraseasonal Oscillation Forecast in the Asian monsoon region from May to October), Climate Monitoring (global drought and flood monitoring information), CLIK (provides downloadable climate prediction data managed by APCC), and other services.
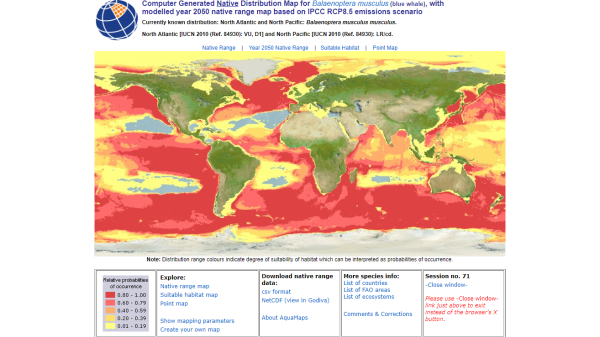
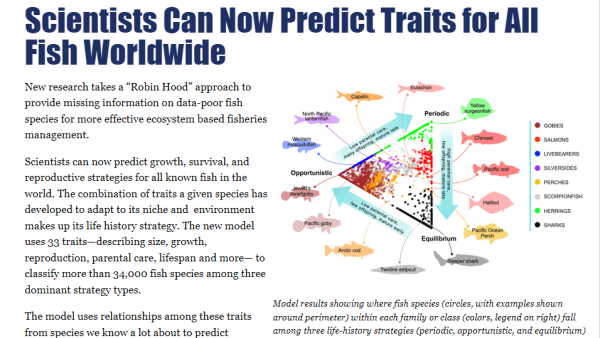
AquaMaps team
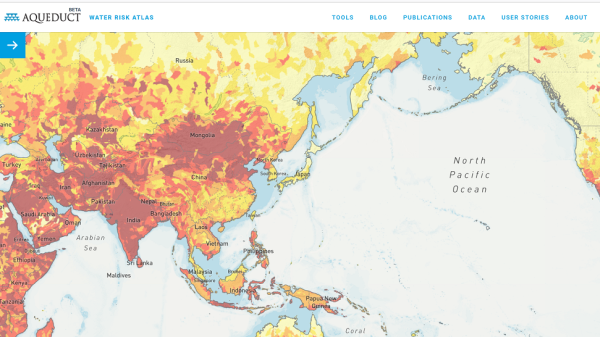
World Resources Institute (WRI)
AQUEDUCT is set of tools to understand and evaluate water risks around the world. The tools are free online maps: Aqueduct Water Risk Atlas, Aqueduct Food, Aqueduct Country Rankings, and Aqueduct Floods. They show water stress, groundwater table decline, coastal floods, droughts, and other water risks. The tools also cover secondary risks such as impact to agriculture and food security.
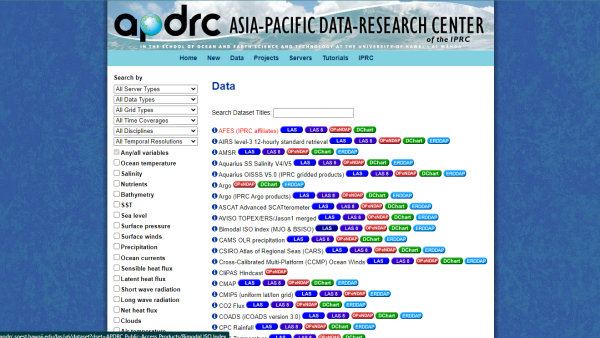
Asia-Pacific Data-Research Center (APDRC) at the International Pacific Research Center (IPRC) at the University of Hawai'i
United Nations Economic and Social Commission for Asia and the Pacific (ESCAP)
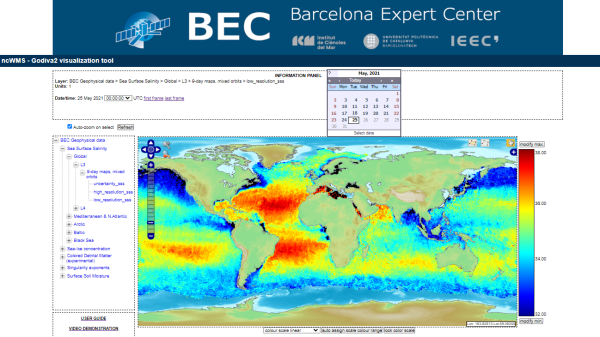
Barcelona Expert Center (BEC)
Barcelona Expert Center (BEC)
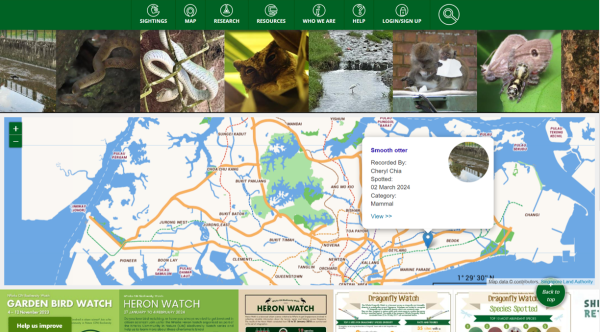
Singapore National Parks Board
BIOME is a repository of biodiversity (flora and fauna, plants and animals of Singapore) and data on related environments contributed by the public, government agencies, educational institutions, and NGOs. With BIOME, users can submit sightings, upload associated data, including photos, search and visualize data on the Singapore map, and analyze. One of its key aims is to facilitate the activity and research of government, researchers, and consultants on biodiversity and the environment.
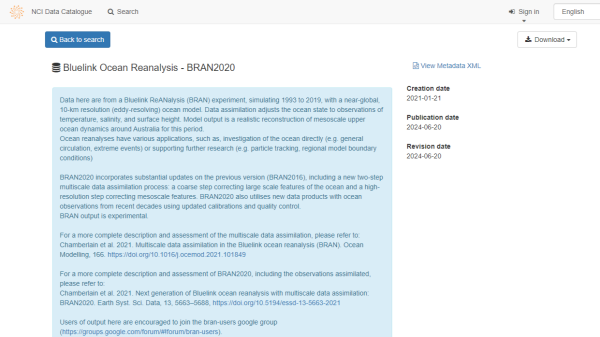
Commonwealth Scientific and Industrial Research Organisation (CSIRO)
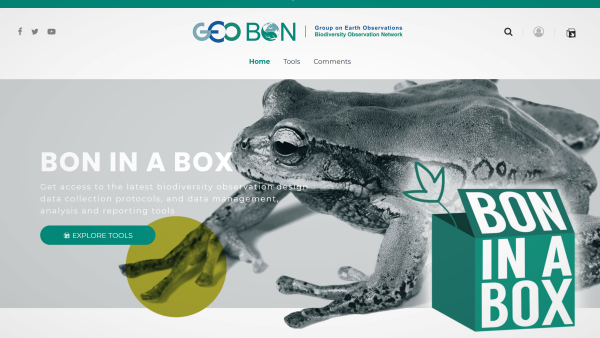
GEO BON
BON in a Box is a regionally customizable and continually updated online toolkit for facilitating the start-up or enhancement of national or regional biodiversity observation systems. It provides acccess to the latest biodiversity observation design, data collection protocols, and data management, analysis and reporting tools. It serves as a technology transfer and capacity building mechanism to ensure users have access to the best and most up-to-date tools and technologies for building a biodiversity observation system. Database includes monitoring methods and guidelines, mapping software, data management tools and platforms and other items, searchable by monitoring techniques, essential biodiversity variables (EBV) classes and other filters.
Centre for Tropical Agriculture (CIAT) , CGIAR Research Program on Climate Change, Agriculture and Food Security (CCAFS)
CCAFS-Climate data portal provides global and regional future high-resolution climate datasets that serve as a basis for assessing the climate change impacts and adaptation in a variety of fields including biodiversity, agricultural and livestock production, and ecosystem services and hydrology.
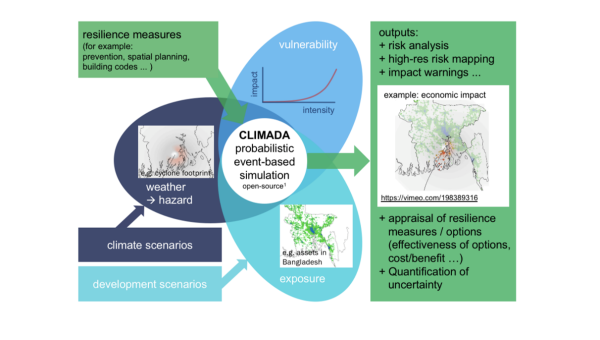
ETH Zurich
CLIMADA is an open-source quantitative model written in two different scripting languages, MATLAB and Python, used to conduct risk assessment on different hazard types (floods, tropical cyclones, droughts, etc.), considering the economics of climate adaptation. CLIMADA allows the evaluation of a portfolio of adaptation measures, quantifying the damage aversion potential and cost-benefit ratio for each measure, which has been applied in more than twenty climate adaptation studies worldwide.
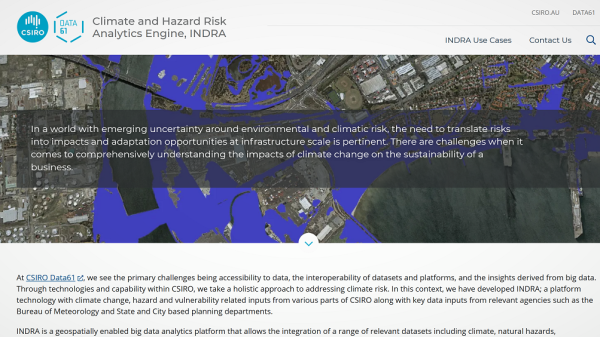
Commonwealth Scientific and Industrial Research Organization (CSIRO), Australia
INDRA is a geospatially enabled big data analytics platform that allows the integration of a range of relevant datasets including climate, natural hazards, infrastructure, demographics and economic metrics to provide data driven critical insights. It is cloud enabled and can be accessed via any of the leading cloud providers and hosted on the web for ease of use and interoperability with other relevant tools. INDRA has been used by cities and utilities to understand their infrastructure risk and to plan for future adaptation, mitigation and financial de-risking strategies.
Columbia Law School at Columbia University
Climate attribution science plays a central role in legal debates on the causal links between human activities, global climate change, and impacts on human and natural systems. The Climate Attribution Database contains 648 scientific resources (e.g., peer-reviewed papers) organized under four categories: climate change attribution, extreme event attribution, impact attribution, and source attribution. Users can seek the resources by selecting one of the categories.
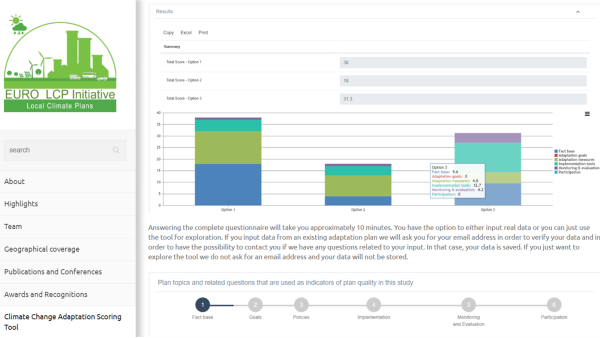
EURO LCP Initiative
This tool evaluates the content of a local adaptation plan. By answering questions about the information contained in the plan, such as climate change impacts, vulnerability assessment, adaptation goals, and adaptation measures, the plan is evaluated and scored. While Europe is the target, assessing local adaptation plans for non-European countries and regions is also possible. To use the tool, users must create an account with an e-mail address and a password.
Global Change Data Lab
European Space Agency (ESA) Climate Office
National Center for Atmospheric Research (NCAR)
National Centers for Environmental Information (NCEI) at National Oceanic and Atmospheric Administration (NOAA)
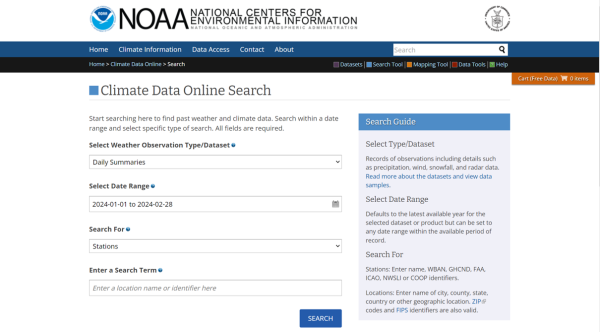
Climate Data Online provides global historical weather and climate data and station history information from the National Climatic Data Center archive in NOAA. These data include quality-controlled daily, monthly, seasonal, and yearly measurements of temperature, precipitation, wind, and degree days, as well as radar data. The website also provides a description of each dataset, links to related tools, FTP access, and downloadable samples.
European Centre for Medium-Range Weather Forecasts (ECMWF)
National Oceanic and Atmospheric Administration (NOAA), National Environmental Modeling and Analysis Center (NEMAC)
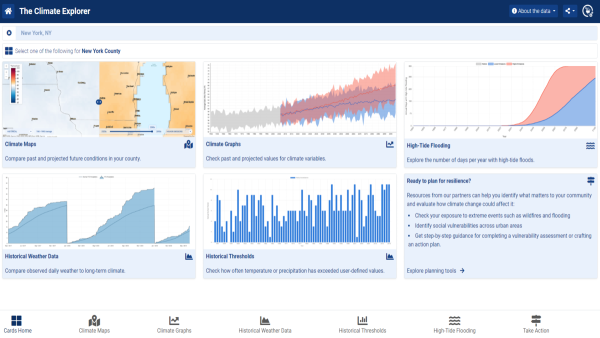
The Climate Explorer is a web application offering interactive maps and graphs to assist users in making decisions for building resilience to extreme events. Built to support the U.S. Climate Resilience Toolkit, the Climate Explorer helps people explore projected climate conditions that may put people, property, and other assets at risk. The Climate Explorer offers graphs and maps of observed and projected temperature, precipitation, and related climate variables for every county in the contiguous United States. Additionally, the tool now offers hindcasts and projections for Alaskan boroughs. The Climate Explorer helps individuals, businesses and communities to understand how climate conditions in their locations are projected to change over coming decades.
National Center for Atmospheric Research (NCAR)
National Ocean and Atmospheric Administration (NOAA) National Centers for Environmental Information
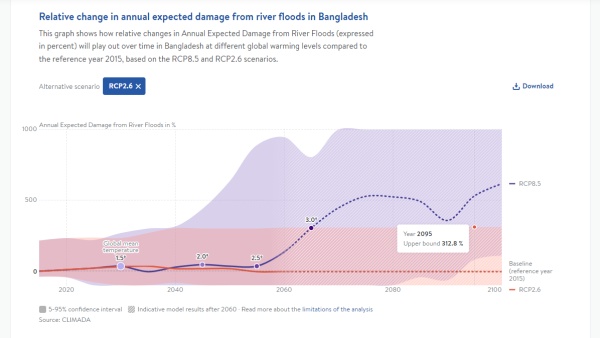
Climate Analytics
Swedish Meteorological and Hydrological Institute (SMHI)
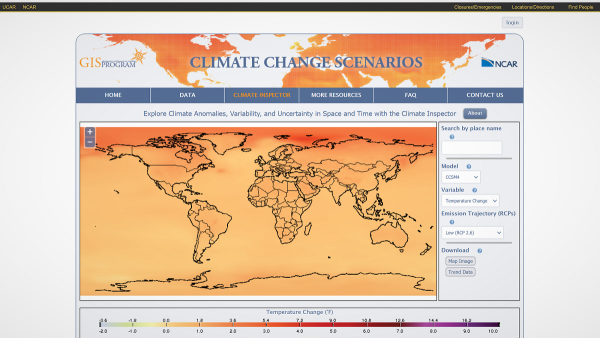
National Center for Atmospheric Research (NCAR)
The Climate Inspector is an interactive web application which expands GIS mapping and graphing capabilities to visualize possible temperature and precipitation changes throughout the 21st century. With Climate Inspector you can explore how temperature and precipitation may change based on different emission trajectories (i.e., Representative Concentration Pathways), investigate climate changes around the globe and through time, inspect climate trends, variability and uncertainty, and download maps and data.
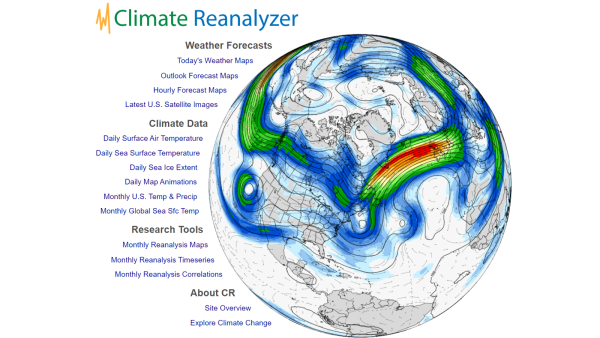
University of Maine Climate Change Institute
Climate Reanalyzer consists of three content areas: "Weather Forecasts," "Climate Data," and "Research Tools." The "Weather Forecast" section provides a map showing the most recent temperature, precipitation, wind speed, and other information. "Climate Data" includes information on time-series changes in temperature and sea surface temperature and other information. In the "Research Tools" section, you can use actual observations and climate model predictions to show the status of temperature and precipitation for any given year and month and analyze correlations with the North Atlantic Oscillation and other climate indexes.
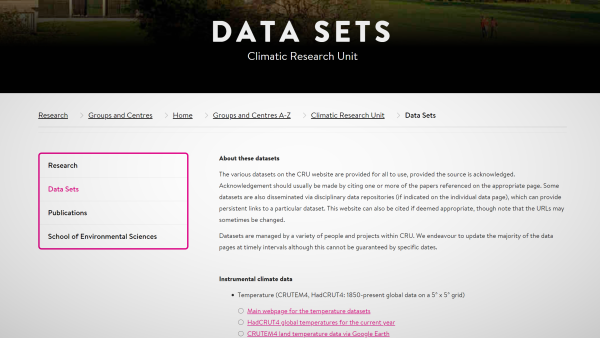
University of East Anglia (UEA)
Climate Research Unit (CRU) of the University of East Anglia (UEA) provides various datasets on its website, including instrumental climate data (e.g., temperature, precipitation and drought, climate data for individual locations), palaeoclimate data, reanalysis climate data, climate model data and future climate projections, and other. The various datasets on the CRU website are provided for all to use, provided the source is acknowledged. Datasets are managed by a variety of people and projects within CRU, which endeavours to update the majority of the data pages at timely intervals although this cannot be guaranteed by specific dates.
Japan International Cooperation Agency (JICA)
Japan Meteorological Agency (JMA)
ClimatView enables viewing and downloading of monthly world climate data, giving users access to statistics on monthly mean temperatures, total precipitation amounts and related anomalies or ratios for all stations where such data are available. Statistics on monthly means of daily maximum/minimum temperatures and Standardized Precipitation Index (SPI) are also provided.
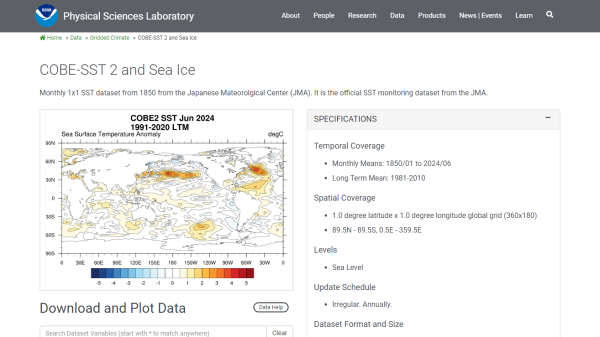
Physical Sciences Laboratory at National Oceanic and Atmospheric Administration (NOAA)
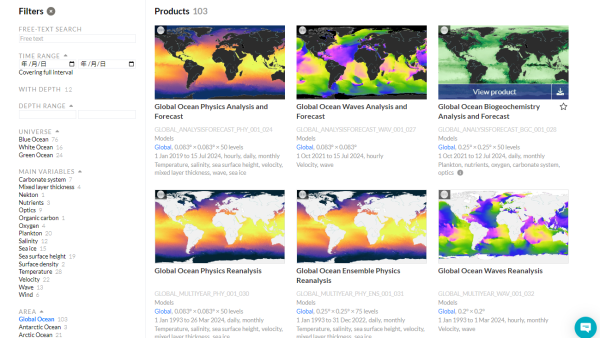
Copernicus Marine Service
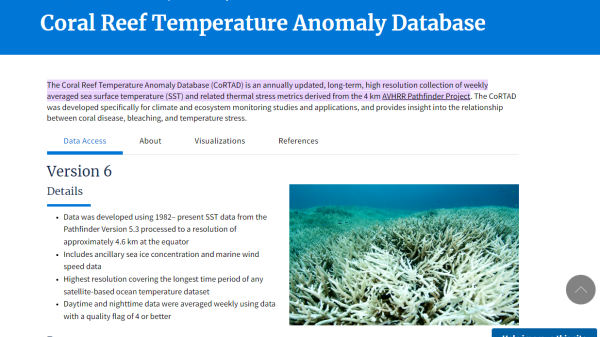
National Centers for Environmental Information (NCEI) at National Oceanic and Atmospheric Administration (NOAA)
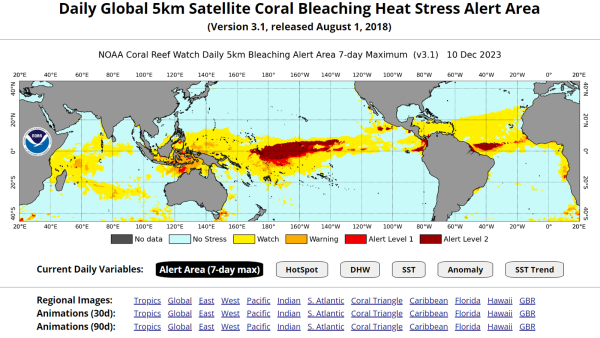
National Oceanic and Atmospheric Administration (NOAA)
Coral Reef Watch (CRW) is a tool that allows you to understand the risk of bleaching that coral reefs worldwide are exposed to. CRW provides data to understand the risk of coral reef bleaching, such as sea surface temperature trends over the past seven days, hot spots with high monthly average sea surface temperatures, accumulated heat stress over the past three months, and areas where coral reef bleaching is being warned based on these data. These data have a 5 km mesh resolution and are updated daily, providing near real-time information.
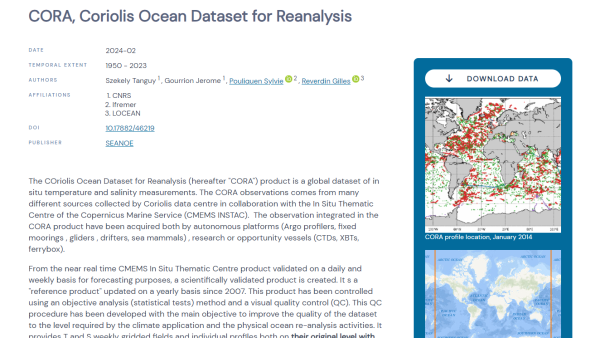
Coriolis Data Centre, In Situ Thematic Centre of the Copernicus Marine Service (CMEMS INSTAC)
Food and Agriculture Organization of the United Nations (FAO)
United Nations Development Programme (UNDP)
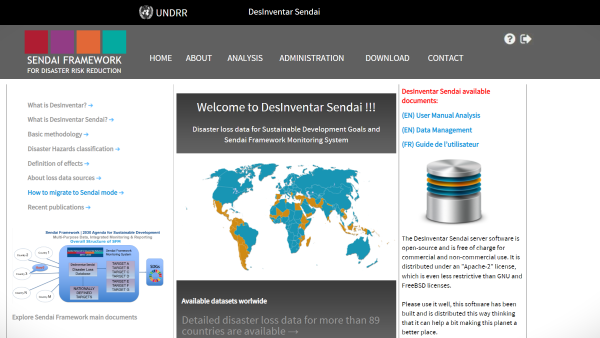
United Nations Office for Disaster Risk Reduction (UNDRR)
DesInventar Sendai is a Disaster Information Management System used as a conceptual and methodological tool to help users analyze disaster trends and their impacts through systematic collection, documentation, and analysis of data about losses caused by disasters associated with natural hazards. It contains datasets of more than 89 countries. Users can view a country’s ‘disaster profile’ or find information about a specific type of disaster in a specific country (e.g., tropical cyclones in Fiji). Disaster types include weather-related events (tsunami, droughts, wildfires, etc.), geological events (earthquakes, volcanoes, etc.), and man-made disasters (accidents, industrial fires, etc.). Effects of disasters have been categorized into 4 groups: Related to people, Related to homes, Related to infrastructure, and Economic losses.
Japan Agency for Marine-Earth Science and Technology (JAMSTEC), The University of Tokyo, Kyoto University, Nagoya University, Hokkaido University, Kitami Institute of Technology, Remote Sensing Technology Center of Japan (RESTEC), National Institute of Informatics (NII), International Centre for Water Hazard and Risk Management (ICHARM), NIPPON KOEI CO., LTD
DIAS collects, archives, integrates and analyses earth observation data, as well as offers a number of tools and software applications to assist data analysis and visualization. Applications can be developed using data from various fields such as climate change, water resources management, agriculture and biodiversity in global environment. DIAS applications include CMIP5 Data Analysis System, AMeNOW! (Precipitation Real-time Visualization Service) and other.
KITAMOTO Asanobu at National Institute of Informatics of Japan (NII)
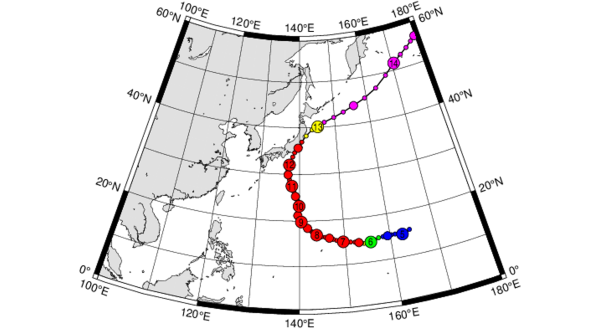
Digital Typhoon is the website that has a comprehensive archive of meteorological satellite "Himawari" images since 1978 and offers a database of about 200,000 typhoon images since 1979 and the best tracks of typhoons since 1951 to search by date, name, location, cloud patterns, and so on. The "Digital Typhoon" project aims to develop techniques to discover relevant, valuable typhoon analysis and prediction knowledge.
National Aeronautics and Space Administration (NASA)
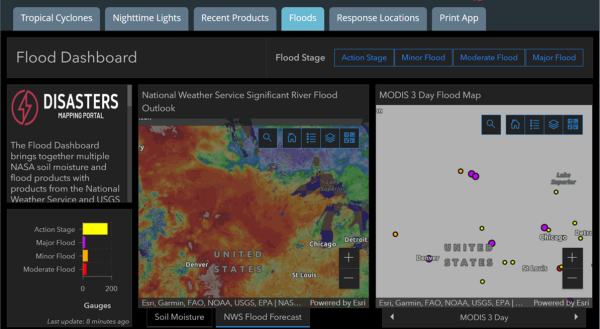
The Disasters Mapping Portal is intended to utilize data from NASA's Earth observation satellites to provide information on natural disasters in the United States through the web-based map. Users can visualize and download real-time information and forecasts on hurricanes, floods, and wildfires, as well as records of past large-scale disasters, on the Web.
University of Florida; International Fertilizer Development Center; other organizations
European Environment Agency, European Commission's Joint Research Centre
United States Geological Survey (USGS)
National Aeronautics and Space Administration (NASA)
National Aeronautics and Space Administration (NASA)
European Centre for Medium-Range Weather Forecasts (ECMWF)
ECMWF Datasets include real-time and archive forecasts, analyses, climate re-analyses, reforecasts and multi-model datasets. Access to the datasets depends on the type of the user, as specified on the ECMWF website (e.g. ECMWF members, researchers, public). User registration is required to download the data.
European Centre for Medium-Range Weather Forecasts (ECMWF)
Centre for Research on the Epidemiology of Disasters (CRED)
EM-DAT contains essential core data on the occurrence and effects of over 22,000 mass disasters in the world from 1900 to the present day. The database is compiled from various sources, including UN agencies, non-governmental organizations, insurance companies, research institutes and press agencies. The main objective of the database is to serve the purposes of humanitarian action at national and international levels. The initiative aims to rationalize decision making for disaster preparedness, as well as provide an objective base for vulnerability assessment and priority setting.
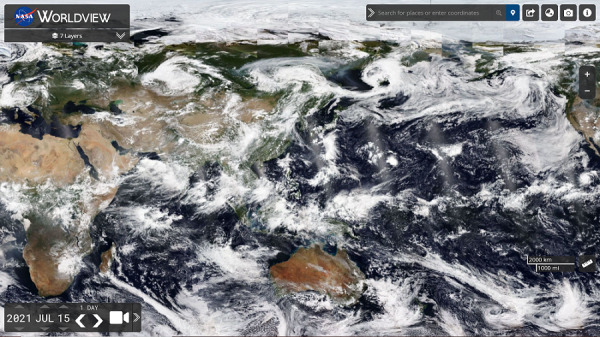
National Auronautics and Space Administration (NASA)
Various maps can be displayed on the basis of the images of the Earth Observation Systems Satellites (EOSDIS) provided by the NASA. Information such as population density, population prediction, vegetation, land use, altitude, wind, ocean current, landslide, temperature, and rainfall can be displayed on the map.
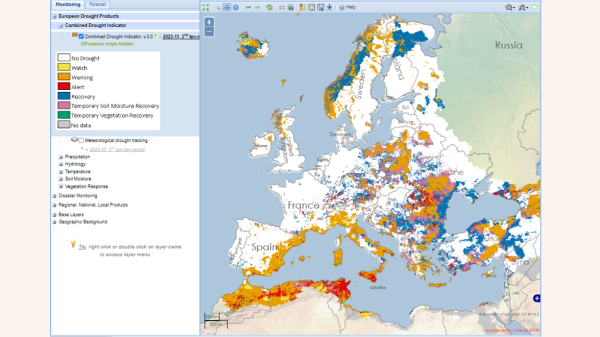
European Commission (EC), Copernicus
The European Drought Observatory (EDO) page provides drought-related information and data from various data sources (e.g., precipitation measurements, satellite measurements, modeled soil moisture content, etc.). Users can use the Map Viewer to view multiple visual indicators and drought-related reports to track recent drought conditions. The data can also be downloaded in file formats such as GeoTIFF and netCDF on the Data Download page.
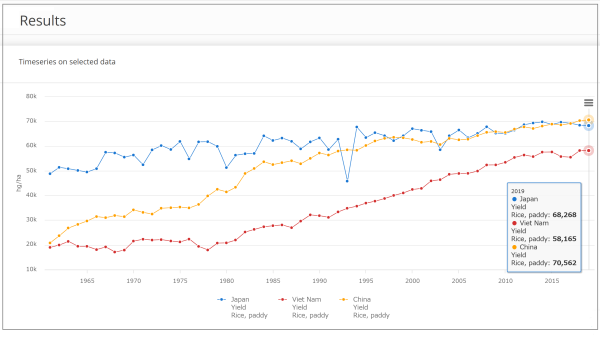
Food and Agriculture Organization of the United Nations (FAO)
FAOSTAT provides free access to food and agriculture data for over 245 countries and territories and covers all FAO regional groupings from 1961 to the most recent year available. Detailed, long-term statistics such as crop yield of various crops, producer and consumer prices, emissions, land use, energy use, food security indicators and many other categories are searchable by country or global region.
United States Agency for International Development (USAID)
National Oceanic and Atmospheric Administration (NOAA) Fisheries Alaska Fisheries Science Center
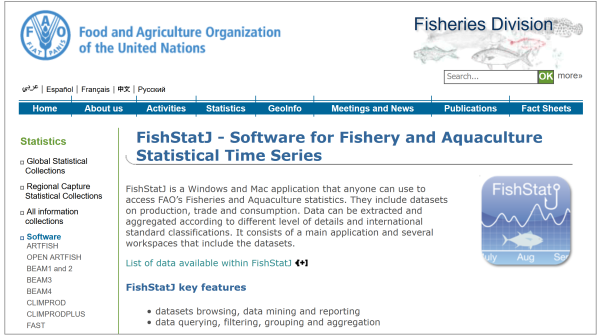
Food and Agriculture Organization of the United Nations (FAO)
FishStatJ is a desktop application designed to disseminate FAO fishery statistical data to the world. FishStatJ's primary aim is to display, refine and export data. However, unlike a spreadsheet software it cannot modify the data, create graphs or perform advanced data analysis. One of FishStatJ’s greatest strength is that it can display species according to several authoritative classifications, such as the International Standard Statistical Classification of Aquatic Animals and Plants (ISSCAAP) or the UN’s Central Product Classification (CPC); and show the scientific name.
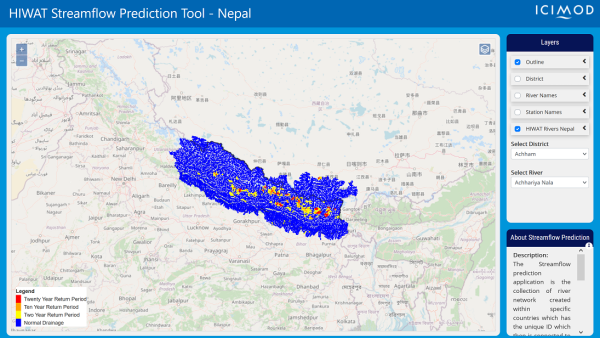
International Centre for Integrated Mountain Development (ICIMOD)
The Flash Flood Prediction application is the collection of river network created within specific countries which has the unique ID which then is connected to the database to have the 48-hours forecast. The user can interact by clicking this river network. This application can be a part of a DSS tool for flood forecasting and give an early warning system to the user.
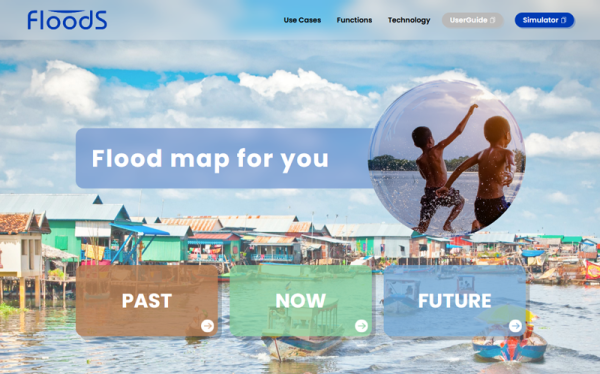
Hitachi, Ltd.
FloodS is a flood forecasting tool designed to enhance flood risk management for stakeholders. It offers two distinct modes of operation: Viewer Mode and Simulation Mode. The Viewer Mode is available to the public, providing access to simulation results for sample scenarios in approximately 10 selected cities, predominantly situated in Asia. The Simulation Mode is exclusively available to registered users. It allows them to conduct their own flood simulations in any location and tailor conditions to their specific requirements, such as defining flood depth and flood flows, or the presence of embankments and tunnels. To gain access to the Simulation Mode, you can become a registered user by following the instructions outlined in the “GET ID” section on the FloodS website.
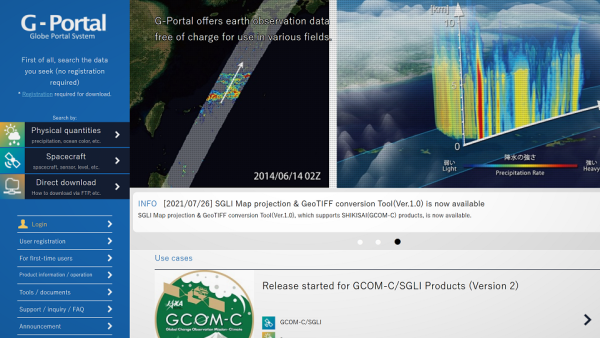
Japan Aerospace Exploration Agency (JAXA)
G-Portal offers earth observation data free of charge for use in various fields. It is a portal system allowing users to search and download products acquired by JAXA's Earth observation satellite. Data are searchable from various geophysical quantities (precipitation, snow depth, vegetation, ocean color, etc.) classified by atmosphere, cryosphere, terrestrial and ocean groups. Data are also searchable by spacecraft/sensor. No registration is required to search the data, but it is required for download.
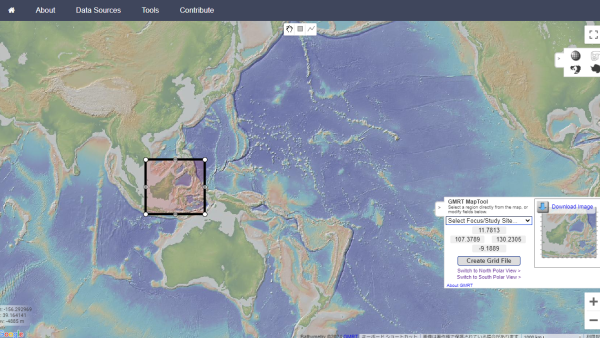
International Hydrographic Organization and Intergovernmental Oceanographic Commission of UNESCO
The General Bathymetric Chart of the Oceans (GEBCO) provides publicly available bathymetry of the world's oceans. The International Hydrographic Organization and the Intergovernmental Oceanographic Commission of UNESCO operate it. GEBCO's current gridded dataset on the sea depths, the GEBCO_2023 Grid, is a global terrain model for ocean and land, providing elevation data in meters on a 15 arc-second interval grid. Users can download the GEBCO_2023 Grid as global files or data in user-defined areas in NetCDF, Esri ASCII raster, or GeoTiff data formats.
GEO BON
GEO BON is a global biodiversity observation network whose mission is to improve the acquisition, coordination and delivery of biodiversity observations and related services to users including decision makers and the scientific community.
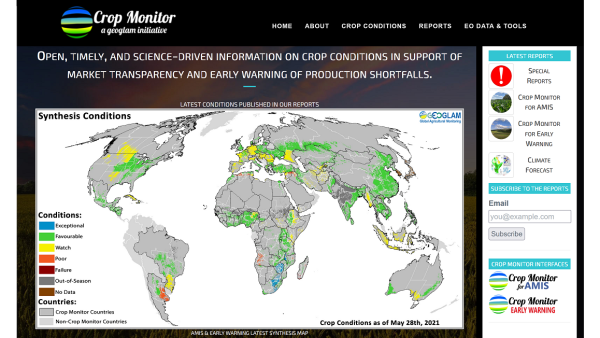
Group on Earth Observations Global Agricultural Monitoring Initiative (GEOGLAM)
Crop Monitor provides open, timely, and science-driven information on crop conditions in support of market transparency (Crop Monitor for AMIS) and early warning of production shortfalls (Crop Monitor for Early Warning). It focuses on four primary crops: wheat, maize, rice, and soybeans. The Crop Monitor for AMIS, developed for the G20 Agricultural Market Information System (AMIS), is an internationally recognized source of information on global crop prospects. It brings together over 40 partners from national, regional (e.g., sub-continental) and global monitoring systems, space agencies, agriculture organizations and universities. The Crop Monitor for Early Warning (CM4EW) is a source of reliable information on crop conditions in vulnerable countries at risk of food production shortfalls. CM4EW is often used to inform humanitarian organization decisions on food allocation and assisstance.
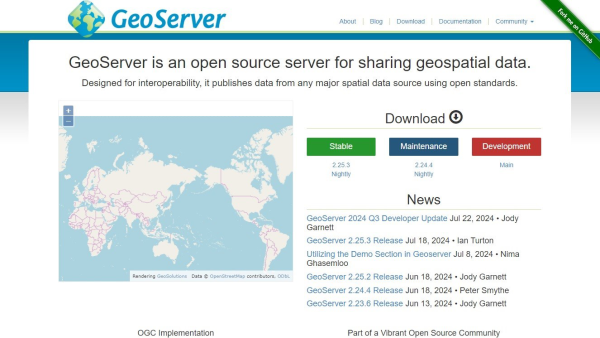
Open Source Geospatial Foundation (OSGeo)
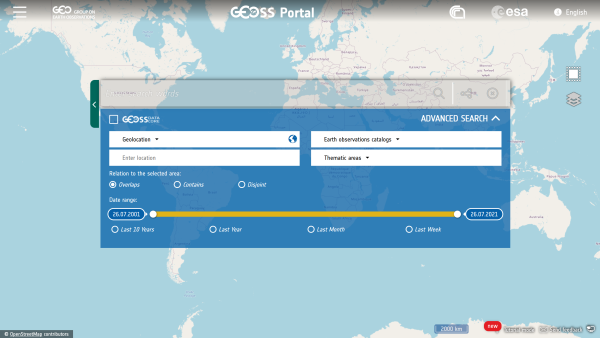
Group on Earth Observations (GEO)
The GEOSS Portal offers a single internet access point to Earth observation data, information and knowledge from all over the world for users from different disciplines. The portal has an easy-to-use interface to discover and access ever-growing quantities of GEO resources. Through the Portal, the GEOSS (Group on Earth Observation System of Systems) Platform connects the users to the collections of databases and other portals and provides reliable information.
Food and Agriculture Organization of the United Nations (FAO)
GIEWS (Global Information and Early Warning System on Food and Agriculture) monitors food supply and demand and other key indicators for assessing the food security situation in all countries. GIEWS collects various data for its activities, and to facilitate widespread use of these datasets in the policy making by individual countries, it has developed several web-based tools: Country Cereal Balance Sheet, Food Price Monitoring and Analysis (FPMA) Tool, Earth Observation for Crop Monitoring, and Food Aid Shipments.
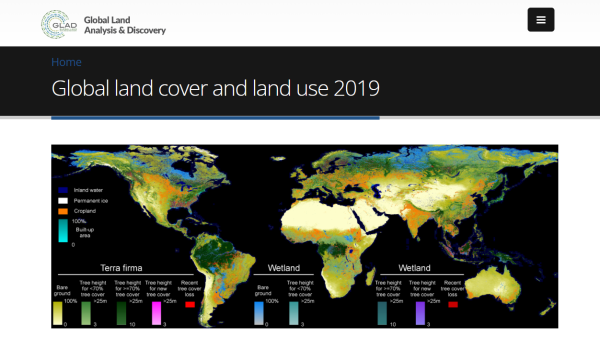
National Aeronautics and Space Administration (NASA)
Global Land Analysis and Discovery (GLAD) laboratory in the Department of Geographical Sciences at the University of Maryland
Global Land Analysis and Discovery (GLAD) laboratory in the Department of Geographical Sciences at the University of Maryland
Global Land Analysis and Discovery (GLAD) laboratory in the Department of Geographical Sciences at the University of Maryland
Global Land Analysis and Discovery (GLAD) laboratory in the Department of Geographical Sciences at the University of Maryland
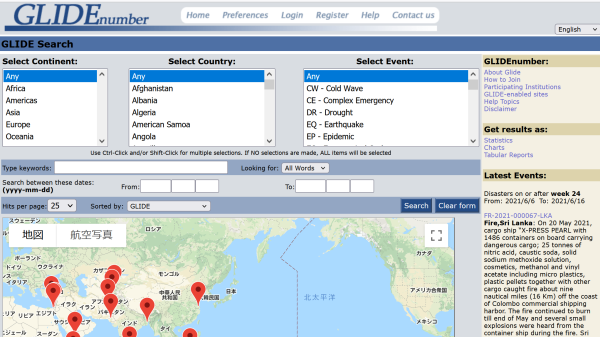
Asian Disaster Reduction Center (ADRC)
Accessing disaster information can be a time consuming and laborious task. Not only is data scattered but frequently identification of the disaster can be confusing in countries with many disaster events. To address both of these issues, Asian Disaster Reduction Center (ADRC) proposed a globally common Unique ID code for disasters. This idea was shared and promoted by the Centre for Research on the Epidemiology of Disasters (CRED) of the University of Louvain in Brussels (Belgium), OCHA/ReliefWeb, OCHA/FSCC, ISDR, UNDP, WMO, IFRC, OFDA-USAID, FAO, La Red and the World Bank and was jointly launched as a new initiative "GLIDE".
Sun Yat sen University
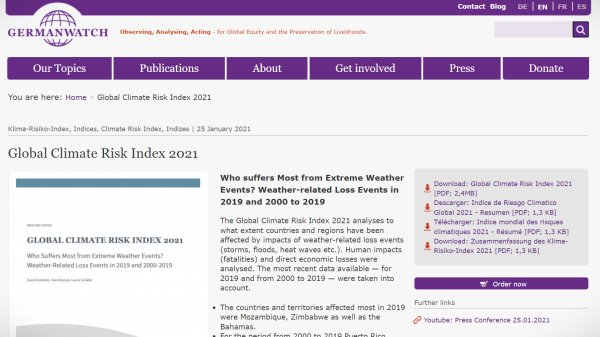
Germanwatch
The Global Climate Risk Index is an annual report that analyses which countries and regions are affected most by extreme weather events (storms, floods, heat waves, etc.). It analyzes and ranks the extent to which countries and regions have been affected by the impacts of climate change by quantifying fatalities and economic losses that occurred, compiling a list of the ten most affected countries. The Climate Risk Index (CRI) score indicates the level of exposure and vulnerability of the countries to extreme weather events and examines both absolute and relative impacts. A low CRI score indicates high vulnerability of a country. This report is published annually by Germanwatch, an independent non-profit and environmental organization based in Germany.
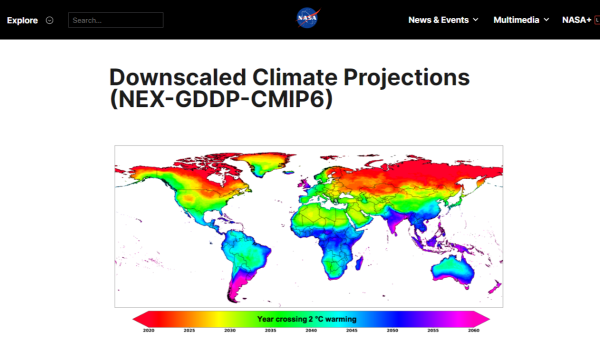
National Aeronautics and Space Administration (NASA)
Global Runoff Data Centre (GRDC)
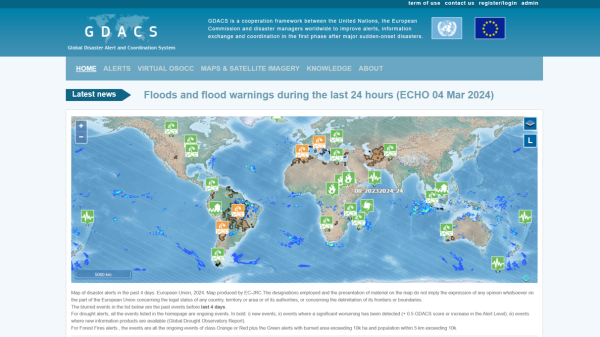
United Nations and the European Commission
Global Disaster Alert and Coordination System (GDACS) shows a map of disaster alerts in the past four days. GDACS is a framework of cooperation between the United Nations and the European Commission, and it includes disaster managers and disaster information systems worldwide. It aims at filling the information and coordination gaps in the first phase after major disasters. The GDACS website also summarizes disaster events caused by earthquakes, tropical cyclones, floods, volcanoes, droughts, and forest fires.
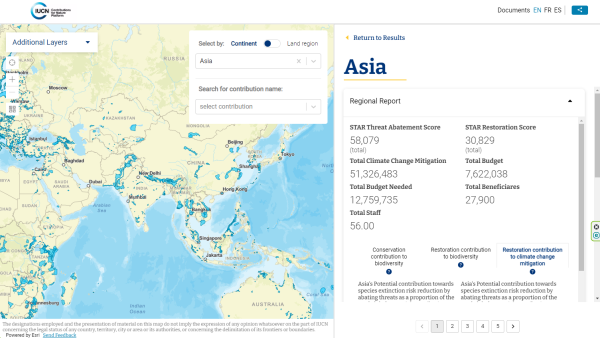
International Union for Conservation of Nature (IUCN)
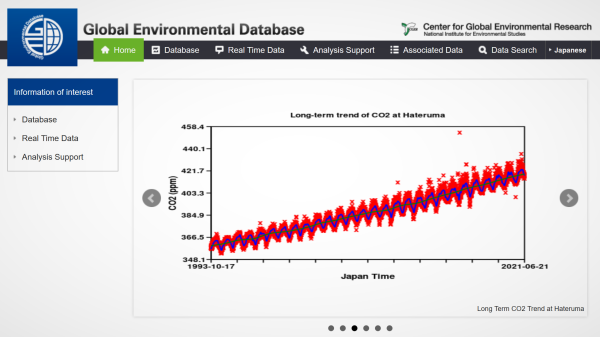
Center for Global Environmental Research (CGER) at the National Institute for Environmental Studies (NIES), Japan
Global Environmental Database (GED) serves as a database related to global environmental problems with an emphasis on global warming and climate change. It provides quality-controlled long-term open data from global atmospheric, oceanic, and terrestrial monitoring projects, almost real-time data of greenhouse gas concentrations, results of the research projects at the Center for Global Environmental Research (CGER) in a wide range of fields, and information on analysis support tools.
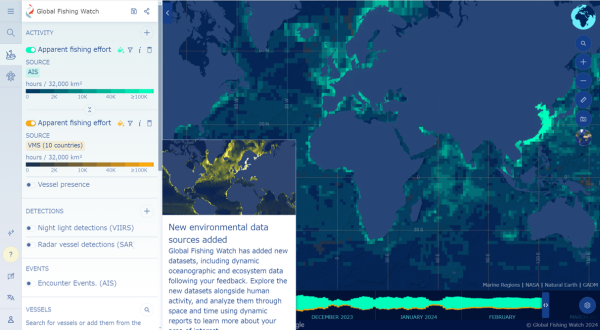
Global Fishing Watch
The Global Fishing Watch map is the open-access online platform for visualizing and analyzing vessel-based human activity at sea. It is aimed to facilitate greater accountability, improved governance, reduced ecological threats, and an ocean that is healthy, productive, and resilient. Users can access the web-based map to monitor global fishing activity from 2012 to the present for more than 65,000 commercial fishing vessels responsible for a significant part of global seafood catch.
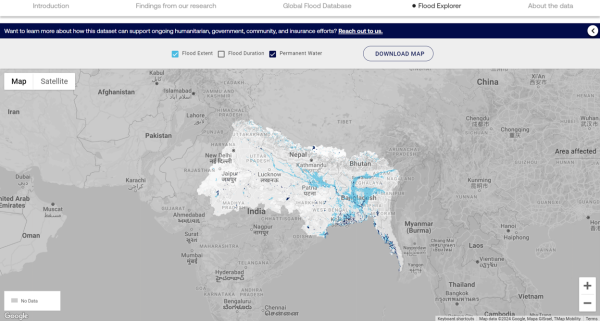
Cloud to Street and The Flood Observatory
The Global Flood Database is a database that tracks where floods have occurred and who has been impacted the most worldwide. Cloud to Street and the DFO Flood Observatory's flood mapping experts combined 15+ years of flood data with human settlement data to create a comprehensive database for researchers, humanitarian workers, community organizations, and insurance and finance providers. Users can select a past flood or a country of interest to view various flood events on the map.
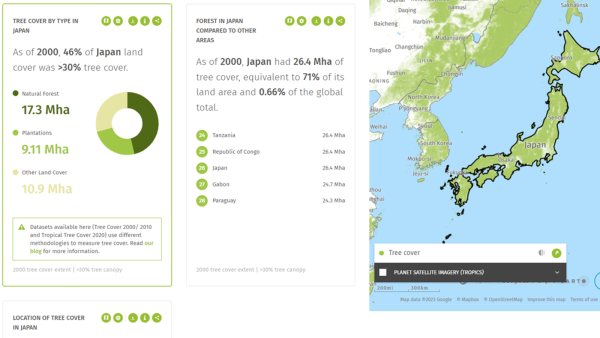
World Resources Institute
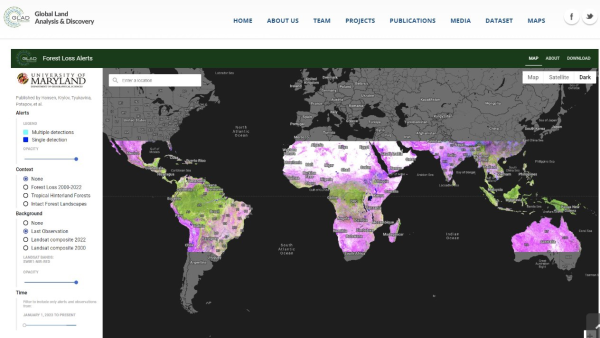
Global Forest Watch (GFW) is a tool that provides information on the state of the world's forests. GFW allows users to select from nearly 50 types of data, including tree cover by forest types, forest loss due to deforestation or fire, CO2 absorption and emissions, and biodiversity. It also provides deforestation alerts via e-mail and a dashboard function that summarizes data on forest status and changes over time by country and region. In addition, a mobile application is available for offline use of GFW data and tools. Data can be analyzed on the map, and the dashboard can be downloaded in Excel.
Global Land Analysis and Discovery (GLAD) laboratory in the Department of Geographical Sciences at the University of Maryland
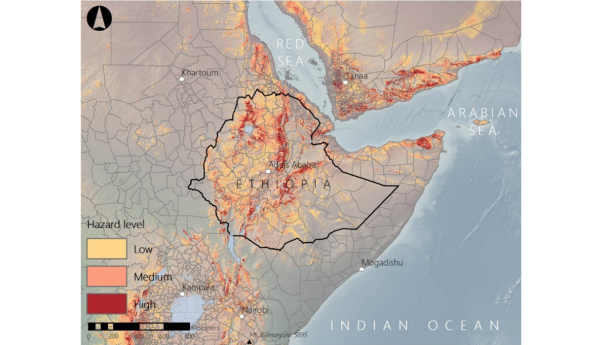
World Bank
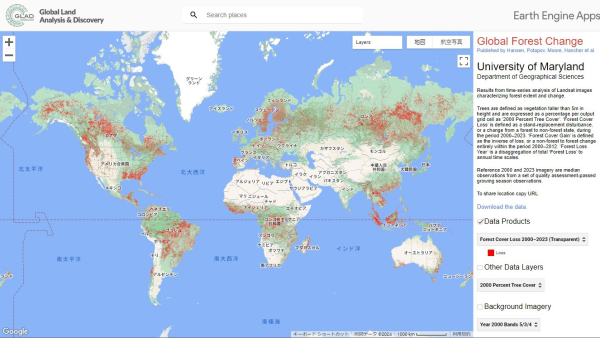
Using a global landslide inventory, landslide susceptibility information provided by NASA, and an innovative machine learning model, the geohazard and risk management experts produced a “Global Landslide Hazard Map.” The dataset comprises gridded maps of the estimated annual frequency of significant landslides triggered by seismicity and rainfall per square kilometer. This dataset is intended to improve hazard screening based on frequency and severity, consistent national, regional, and global scale exposure assessment, and estimates of the annual expected impact on the population and the built environment.
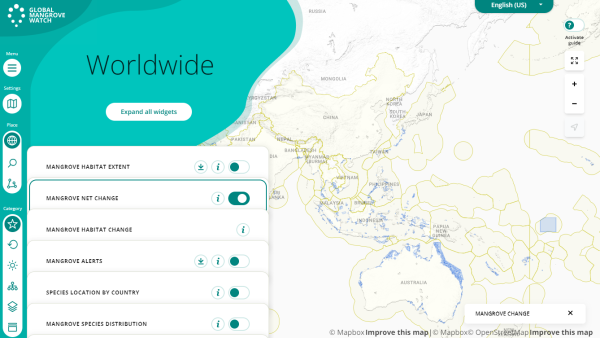
Global Mangrove Alliance
Lamont-Doherty Earth Observatory of Columbia University
Copernicus Marine Service
Copernicus Marine Service
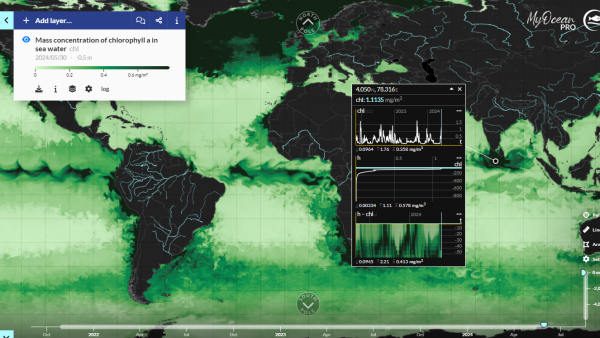
Global Ocean Biogeochemistry Hindcast provides data on 3D biogeochemical fields for 1993-2019 at 1/4 degree and 75 vertical levels. It uses the PISCES biogeochemical model (available on the NEMO modeling platform). Simulated data of chlorophyll, nitrate, phosphate, silicate, dissolved oxygen, primary production, etc., are provided in NetCDF format.
National Centers for Environmental Information (NCEI) at National Oceanic and Atmospheric Administration (NOAA)
The Global Ocean Current Database (GOCD) contains ocean current data from various capture methods, resolutions, and formats in a single format (NetCDF) archive. The GOCD Data Access portal gives search interfaces for moored current meters, acoustic Doppler profilers, drifting platforms, high-frequency radar, and ocean glider data. Users can search for and download the data they need.
Physical Sciences Laboratory at National Oceanic and Atmospheric Administration (NOAA)
Center for Sustainability and the Global Environment (SAGE), UNIVERSITY of WISCONSIN–MADISON
Consejo Superior de Investigaciones Científicas (CSIC)
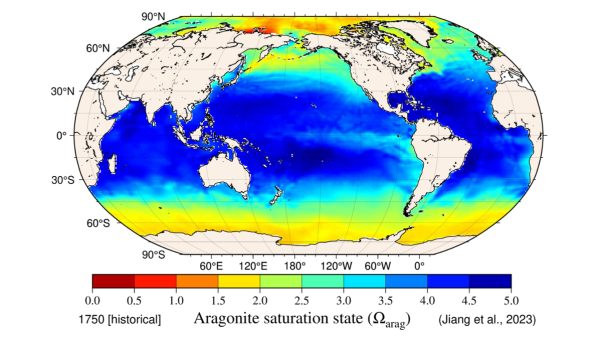
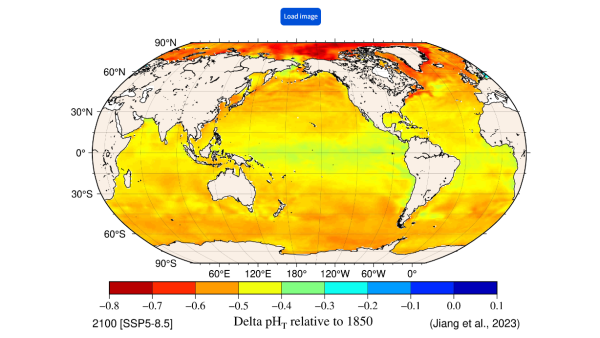
National Centers for Environmental Information (NCEI) at National Oceanic and Atmospheric Administration (NOAA)
Global Surface Ocean Acidification Indicators provide pre-plotted maps of Indicators from 1750 to 2100. Users select an indicator (e.g., aragonite saturation state, salinity), type of data (real values or delta values), emission scenario, and target year and then visualize the indicators on a global map. Users can also acquire the whole data set of Global Surface Ocean Acidification Indicators and the methods employed in NetCDF format.
National Centers for Environmental Information (NCEI) at National Oceanic and Atmospheric Administration (NOAA)
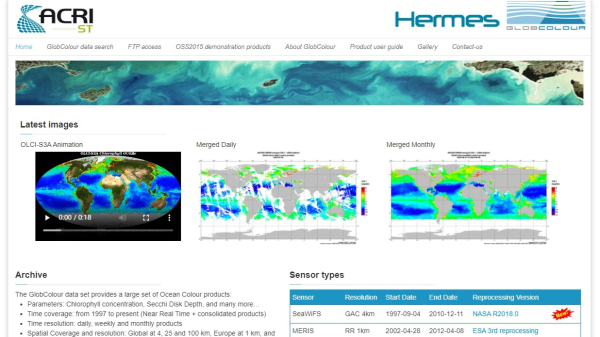
ACRI-ST
National Oceanography Centre
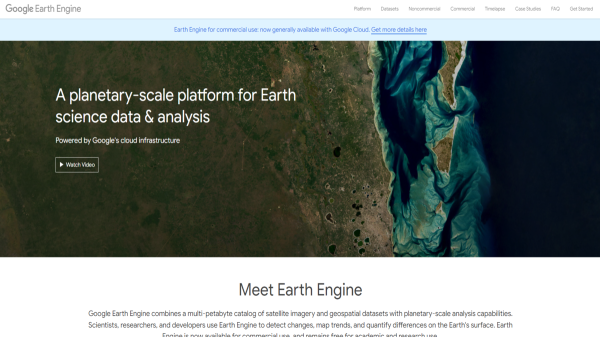
Alphabet Inc.
Earth Engine is a tool for analyzing geospacial information. It is a platform for scientific analysis and visualization of geospatial datasets, for academic, non-profit, business and government users. Earth Engine hosts satellite imagery and stores it in a public data archive that includes historical earth images going back more than forty years. The images, ingested on a daily basis, are then made available for global-scale data mining. Earth Engine also provides APIs and other tools to enable the analysis of large datasets.
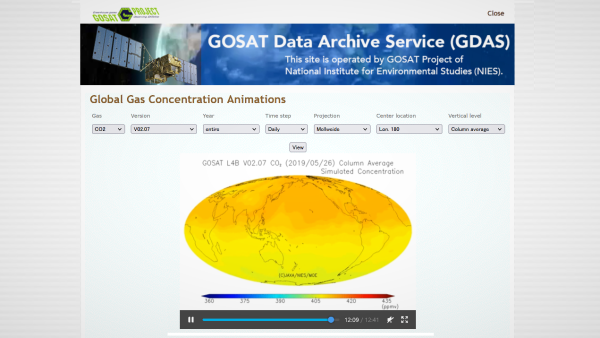
GOSAT Project, National Institute for Environmental Studies (NIES), Japan
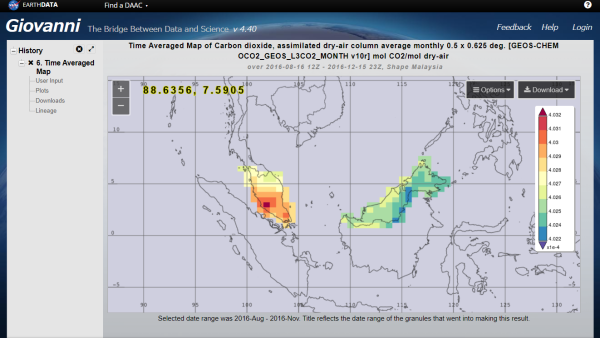
GOSAT Animations are visualizations of global carbon dioxide (CO2) and methane (CH4) emissions since 2009 until recently, based on the GOSAT Data Archive Service. Animation is displayed after the user selects options in the filters and presses "View". In the GOSAT Project, a satellite (Greenhouse Gases Observing Satellite, GOSAT) observes the Earth with onboard sensors which measure infrared light reflected and emitted from the Earth's surface and the atmosphere. From these observational data, CO2 and CH4 concentrations are calculated. The purpose of the GOSAT project is to estimate emissions and absorptions of the greenhouse gases (GHG) on a subcontinental scale, and the CO2 and CH4 animations are one of the products of the project.
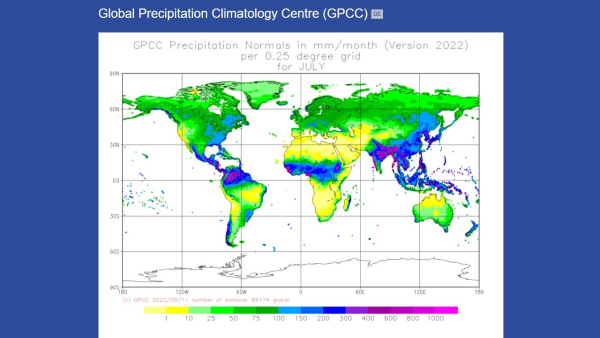
Deutscher Wetterdienst (DWD)
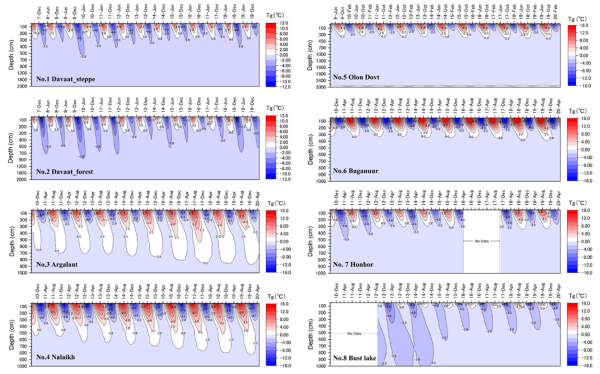
National Institute for Environmental Studies (NIES), Japan
The dataset provides daily average ground temperature profiles (GTs) measured at eight boreholes in diverse ecosystems across Mongolia. With depths ranging from 10 to 30 meters, these boreholes capture temperature variations in steppes, forests, and wetlands. Spanning several years, the data is crucial for understanding the thermal dynamics of these regions, aiding ecological research, climate studies, and the assessment of permafrost stability amidst environmental changes.
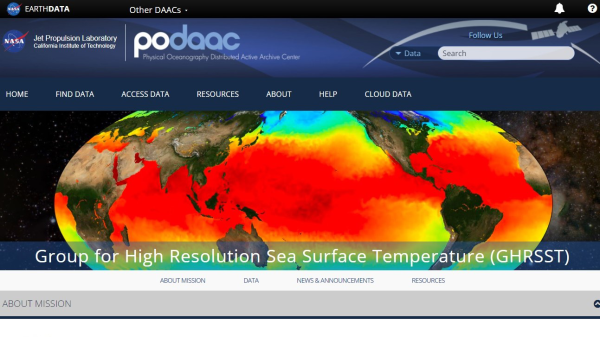
National Aeronautics and Space Administration (NASA)
Met Office Hadley Centre
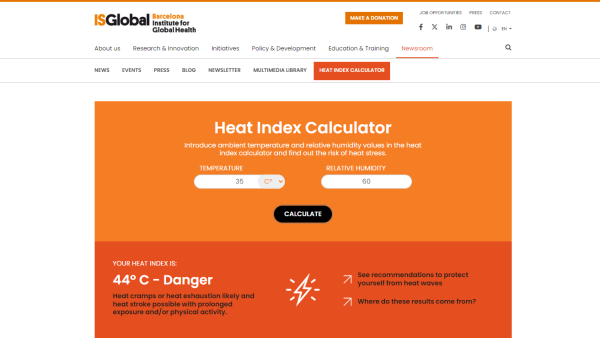
Barcelona Institute for Global Health (IS Global)
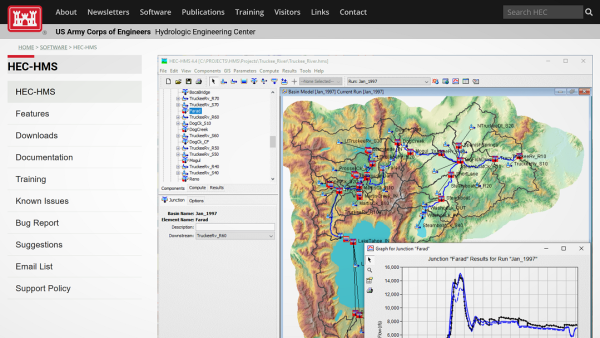
U.S. Army Corps of Engineers Hydrologic Engineering Center (HEC)
The Hydrologic Modeling System (HEC-HMS) is designed to simulate the complete hydrologic processes of dendritic watershed systems. The software includes many traditional hydrologic analysis procedures such as event infiltration, unit hydrographs, and hydrologic routing. HEC-HMS also includes procedures necessary for continuous simulation including evapo-transpiration, snowmelt, and soil moisture accounting. Advanced capabilities are also provided for gridded runoff simulation using the linear quasi-distributed runoff transform (ModClark). Supplemental analysis tools are provided for model optimization, forecasting streamflow, depth-area reduction, assessing model uncertainty, erosion and sediment transport, and water quality. The software features a completely integrated work environment including a database, data entry utilities, computation engine, and results reporting tools. A graphical user interface allows the user seamless movement between the different parts of the software. Simulation results are stored in HEC-DSS (Data Storage System) and can be used in conjunction with other software for studies of water availability, urban drainage, flow forecasting, future urbanization impact, reservoir spillway design, flood damage reduction, floodplain regulation, and systems operation.
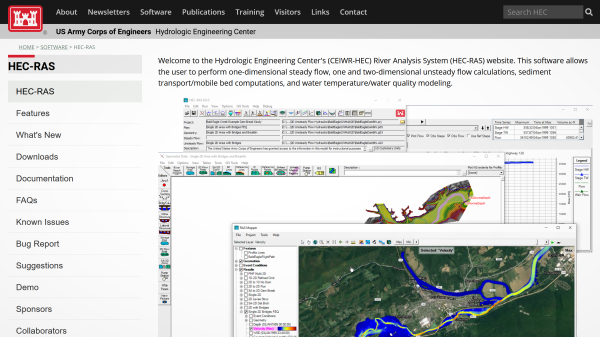
U.S. Army Corps of Engineers Hydrologic Engineering Center (HEC)
This software allows the user to perform one-dimensional steady flow, one and two-dimensional unsteady flow calculations, sediment transport/mobile bed computations, and water temperature/water quality modeling.
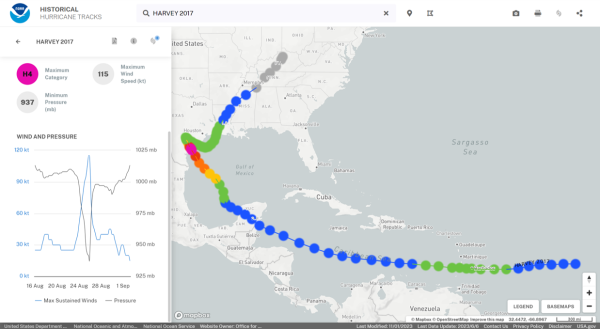
National Oceanic and Atmospheric Administration (NOAA)
Historical Hurricane Tracks is the database of over 13,000 storm tracks on record. Users can search storms by a specific location, storm, year, or ocean basin, save the information for future use, and share it with others. After identifying storms on the map, users can get detailed information by clicking a specific storm in the list or from the map. Users will see the entire storm track, obtain data about the storm’s maximum wind speed and minimum pressure, and find links to a technical report and additional storm details.
National Centers for Environmental Information (NCEI) at National Oceanic and Atmospheric Administration (NOAA)
The International Best Track Archive for Climate Stewardship (IBTrACS) project is a collection of tropical cyclone data from around the world. It integrates recent and historical tropical cyclone data maintained by multiple organizations and provides a best track dataset of tropical cyclones. IBTrACS is being undertaken in cooperation with all of the World Meteorological Organization's (WMO) regional specialized weather centers and other organizations and individuals worldwide. The data is updated twice weekly and can be downloaded in file formats such as CSV, NetCDF, and shapefiles.
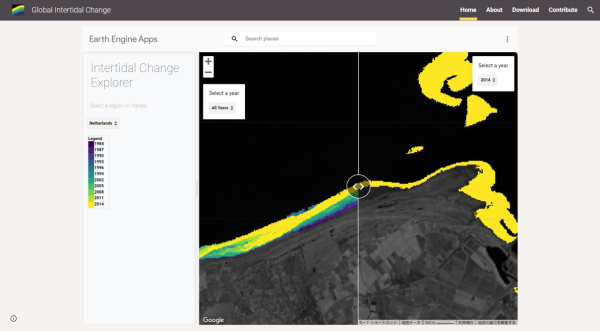
Nicholas Murray
Intertidal Change Explore uses machine learning analysis of satellite images to map the global distribution and change of intertidal areas over 30 years. It provides the results from a supervised classification using various predictor layers, including Landsat images (courtesy USGS/NASA) and topographic data, to identify intertidal areas. Users can visualize the classification results on the map and download the data.
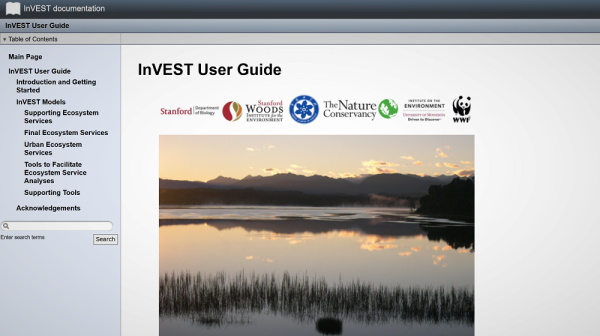
Stanford University
InVEST is a suite of free, open-source software models used to map and value the goods and services from nature that sustain and fulfill human life. It helps explore how changes in ecosystems can lead to changes in the flows of various benefits to people. If properly managed, ecosystems yield a flow of services that are vital to humanity, including the production of goods (e.g., food), life-support processes (e.g., water purification), and life-fulfilling conditions (e.g., beauty, recreation). Despite its importance, this natural capital is scarcely monitored. InVEST enables decision makers to assess quantified tradeoffs associated with alternative management choices and to identify areas where investment in natural capital can enhance human development and conservation. InVEST is part of the Natural Capital Project (NatCap) at the Stanford University.
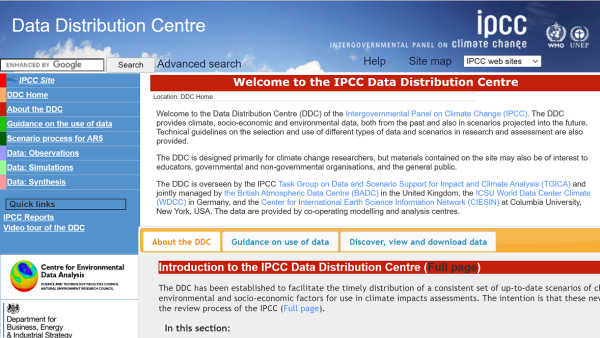
Intergovernmental Panel on Climate Change (IPCC)
IPCC Data Distribution Center (DDC) provides climate, socio-economic and environmental data, both from the past and also in scenarios projected into the future. Technical guidelines on the selection and use of different types of data and scenarios are also provided. The DDC is designed primarily for climate change researchers, but the materials may also be of interest to educators, governmental and non-governmental organizations, and the general public.
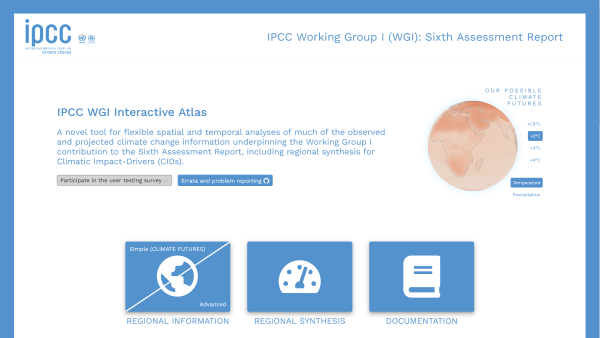
Intergovernmental Panel on Climate Change (IPCC)
IPCC WGI Interactive Atlas enables users to explore much of the climate change information in the IPCC Sixth Assessment Report contributed by the Working Group I (WGI). The Interactive Atlas has two components: regional information and regional synthesis. In the first component - regional information - users can generate global and regional maps and graphs of observed and projected climate change for different key variables (temperature, precipitation, snowfall, CO2 anthropogenic emissions and other), specific seasons of the year, time periods, emission scenarios and climate models. To accomodate users with different needs, regional information includes two alternative interfaces: simple (mainly for the general public, media, teachers and decision makers) and advanced (mainly for researchers and practitioners). The second component - regional synthesis - provides information about changes in Climate Impact Drivers (CIDs) in categories such as extreme heat, cold spell, river or coastal flood, heavy rain, landslide, aridity, mean wind speed, sea ice, and other. Users can select impact-drivers and visualize the regional historical trends and projected changes over the sub-continental reference regions. Data can be downloaded in various multiple formats (from Png to NetCDF) and shared on social networks.
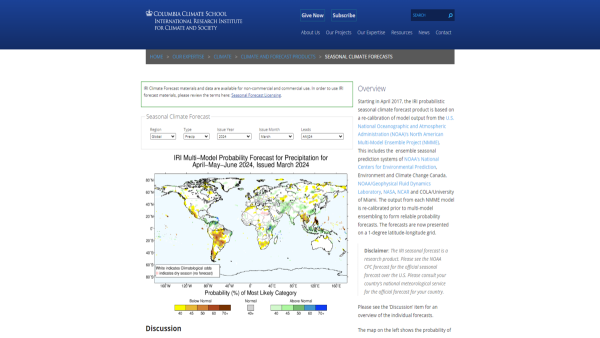
International Research Institute for Climate and Society (IRI) at the Columbia University
IRI Climate and Forecast Products provide an extensive collection of forecast, monitoring, and analysis products. These include: (1) Seasonal Climate Foreasts (precipitation and temperature), (2) El Niño-Southern Oscillation (ENSO) Forecasts, (3) Tailored Climate Products (climate information tailored for health, water resources, agriculture and disaster management purposes, such as the US-Mexico Drought Prediction, the Climate and Agriculture Maproom, etc.), and (4) Climate Change and Decade-Scale Information.
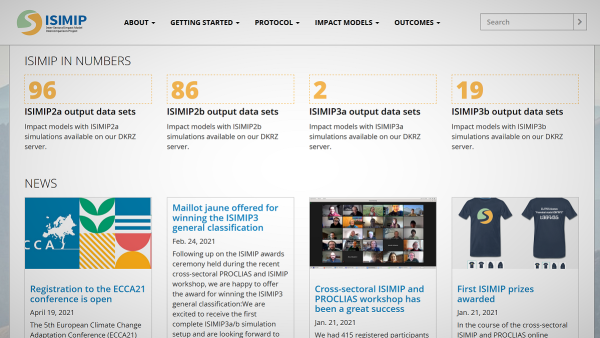
Potsdam Institute for Climate Impact Research (PIK), International Institute for Applied Systems Analysis (IIASA)
ISIMIP is a community-driven climate-impacts modelling initiative. It offers a consistent framework for cross-sectoral, cross-scale modelling of the impacts of climate change. An international network of climate-impact modellers contribute to a comprehensive picture of the world under different climate-change scenarios. You can access ISIMIP data as external user (via ISIMIP repository), or as an active ISIMIP participant (if you are contributing simulations following the ISIMIP protocol).
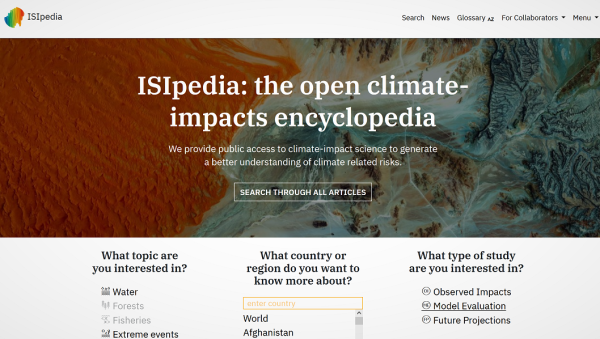
Potsdam Institute for Climate Impact Research (PIK), European Research Area for Climate Services (ERA4CS)
ISIpedia is an online portal for national-level, cross-sectoral climate-impact assessments, based on state-of-the-art climate-impacts simulations from the Inter-Sectoral Impact Model Intercomparison Project (ISIMIP). ISIpedia, as a database of scientific studies (articles) on observed climate impacts, model evaluation and future projections, provides public access to climate-impact science to generate a better understanding of climate related risks.
International Union for Conservations of Nature (IUCN)
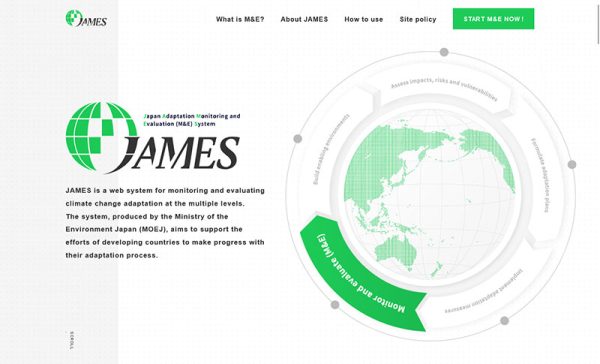
Ministry of the Environment Japan (MOEJ), National Institute for Environmental Studies (NIES)
JAMES is a comprehensive online tool designed for monitoring and evaluation (M&E) of climate change adaptation initiatives. Primarily intended for government officials in developing countries, JAMES facilitates the identification of challenges and areas for improvement in adaptation efforts. Users customize their evaluation by selecting specific criteria such as country, sector (e.g., natural disaster, agriculture), scope of work (e.g., Identifying adaptation options, Funding), and the type of planning (e.g., National Adaptation Plan (NAP), Provincial land-use plan, Local water supply master plan), and provide responses to multiple questions about their initiative in a scorecard format. JAMES then analyzes the information to generate comprehensive results. Geographically, JAMES covers selected countries in Asia, the Pacific, Africa, and Central and South America.
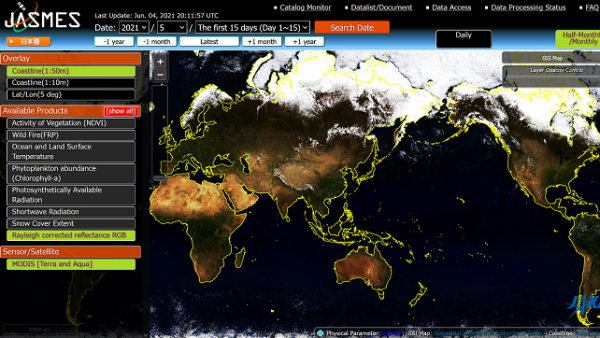
Japan Aerospace Exploration Agency (JAXA)
JASMES (JAXA Satellite Monitoring for Environmental Studies) provides satellite datasets but also information on the current status of the climate variables such as solar radiation reaching the earth's surface (photosynthetically available radiation), cloudiness, snow and sea ice cover, dryness of vegetation (water stress trend), soil moisture, wild fire, precipitation, land and sea surface temperature.
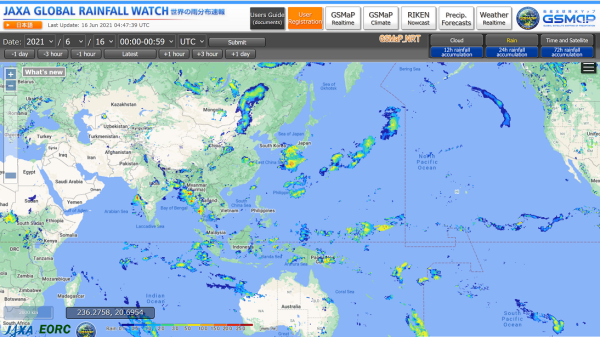
Japan Aerospace Exploration Agency (JAXA)
JAXA Global Rainfall Watch uses multiple satellites, visualizes the world's rain distribution every hour, and provides data.
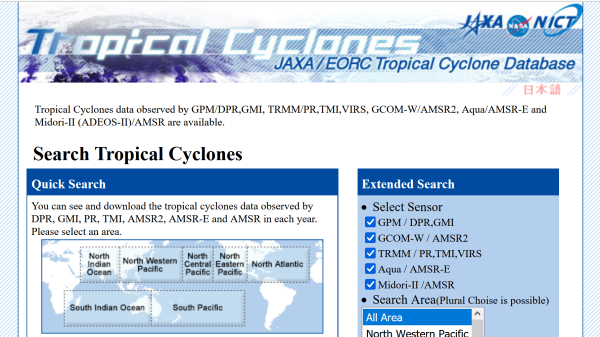
Earth Observation Research Center (EORC), Japan Aerospace Exploration Agency (JAXA)
JAXA/EORC Tropical Cyclones Database allows users to search and download tropical cyclones data from multiple satellites in the Pacific, Atlantic and Indian Ocean from 1997 until present. The database is linked to Tropical Cyclones Real-Time Monitoring, also provided by JAXA/EORC.
Earth Observation Research Center (EORC), Japan Aerospace Exploration Agency (JAXA)
JAXA/EORC Tropical Cyclones Real-Time Monitoring allows users to check information about active and recent (last two months) tropical cyclones/typhoons in Asia, America and Oceania. The real-time monitoring is linked with JAXA/EORC Tropical Cyclones Database, where you can check historical cyclone data.
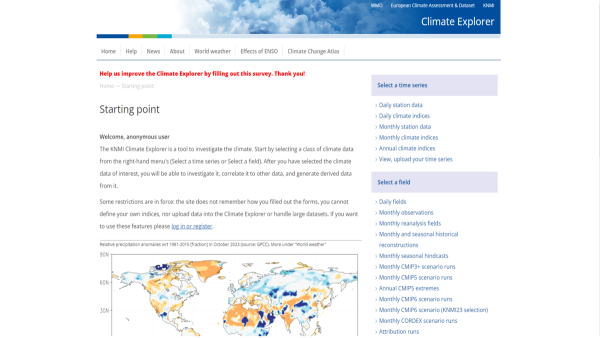
The Royal Netherlands Meteorological Institute (KNMI) / World Meteorological Organization (WMO)
The KNMI Climate Explorer is a scientific tool to investigate the climate and statistically analyze climate data. It is a web application which contains more than 10 TB of climate data and dozens of analysis tools. It is part of the WMO Regional Climate Centre at KNMI. Users can start by selecting a class of climate data from the right-hand menu. After selecting the time series or fields of interest, users can investigate it, correlate it to other data, and generate derived data. Some features are only available upon registration.
United Nations Environment World Conservation Monitoring Centre (UNEP-WCMC)
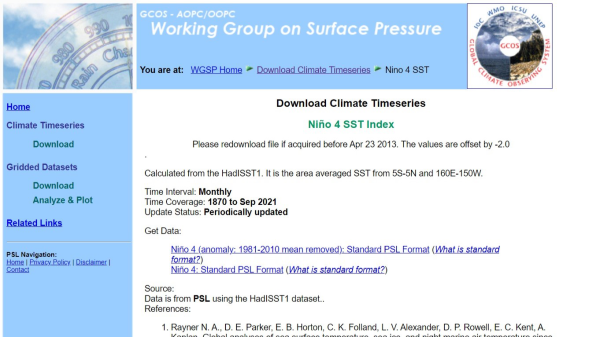
Physical Sciences Laboratory (PSL) at National Oceanic and Atmospheric Administration (NOAA)
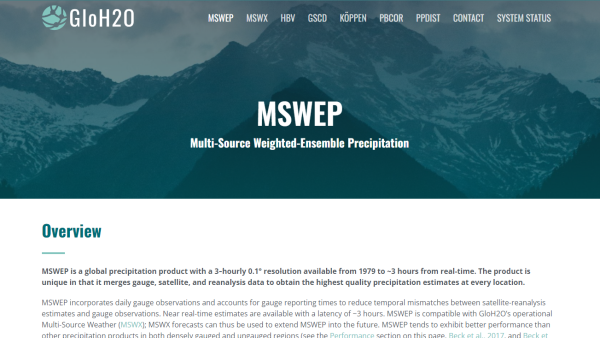
GloH2O
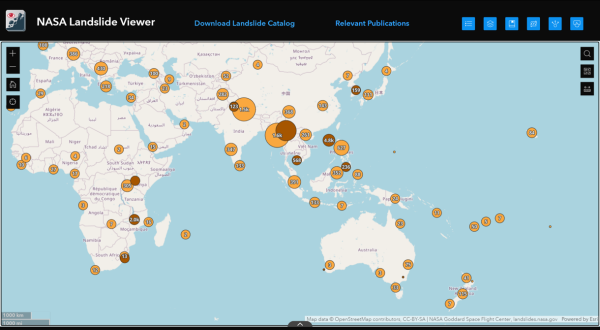
National Aeronautics and Space Administration (NASA)
Landslide Viewer is a web portal that provides global landslide data from NASA, citizen scientists, and other resources. Through the map-based website, users and communities worldwide can acquire information on where and when landslides occurred, including related situations. They can also download the data as a geodatabase file, Shapefile, or CSV.
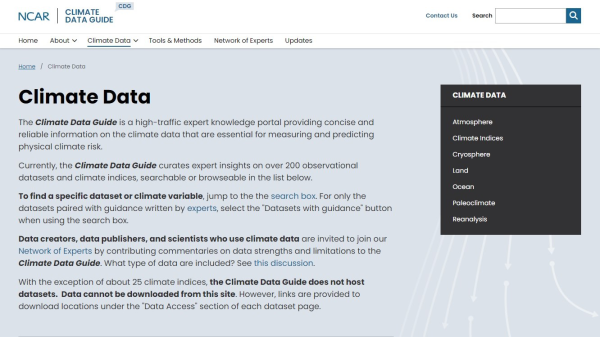
National Center for Atmospheric Research (NCAR)
National Center for Atmospheric Research (NCAR)
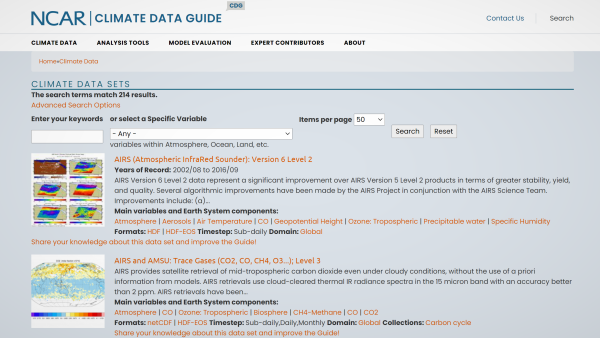
NCAR Climate Data Guide (CDG) is a database where you can search and access 214 data sets coverring the Atmosphere, Ocean, Land and more.You can explore climate indices, reanalyses and satellite data, and understand their application to climate model metrics.CDG provides concise and reliable information on the strengths and limitations of the key observational data sets, tools and methods used to evaluate Earth system models and to understand the climate system. Citable expert commentaries are authored by experienced data users and developers, enabling scientists to multiply the impacts of their work and the diverse user community to access and understand the essential data.
National Ocean and Atmospheric Administration (NOAA) Physical Sciences Laboratory
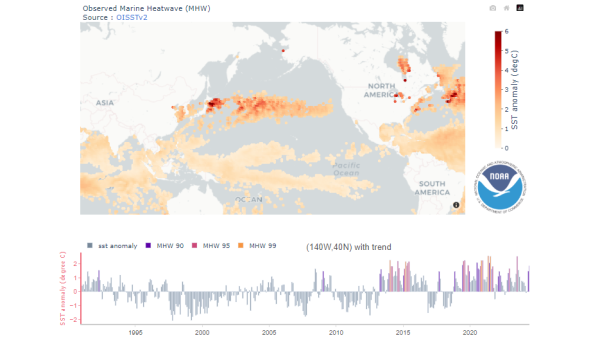
National Oceanic and Atmospheric Administration (NOAA)
The NOAA 1/4° Daily Optimum Interpolation Sea Surface Temperature (OISST) is a long-term data of sea surface temperature that incorporates observations from different platforms (satellites, ships, buoys, and Argo floats) into a regular global grid with a resolution of 1/4°. The dataset is interpolated to fill gaps on the grid and create a spatially complete sea surface temperature map. Users can download the data in a NetCDF format, and so on.
National Oceanic and Atmospheric Administration (NOAA) and Coral Reef Watch
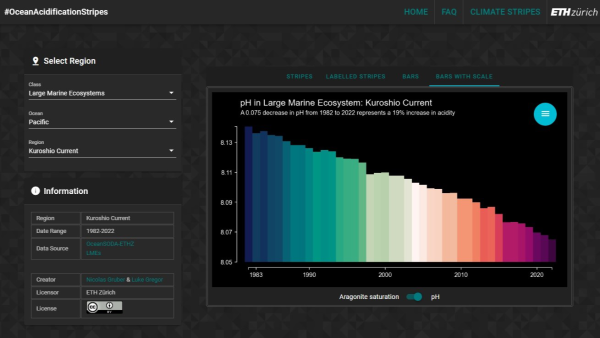
Eidgenössische Technische Hochschule Zürich (ETH Zürich)
Intergovernmental Oceanographic Commission (IOC) of United Nations Educational, Scientific and Cultural Organization (UNESCO)
European Space Agency (ESA), Plymouth Marine Laboratory (PML)
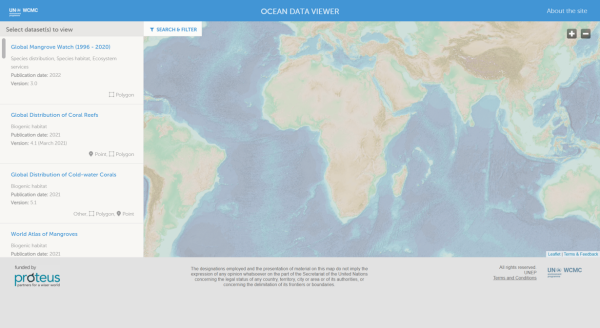
UN Environment World Conservation Monitoring Centre
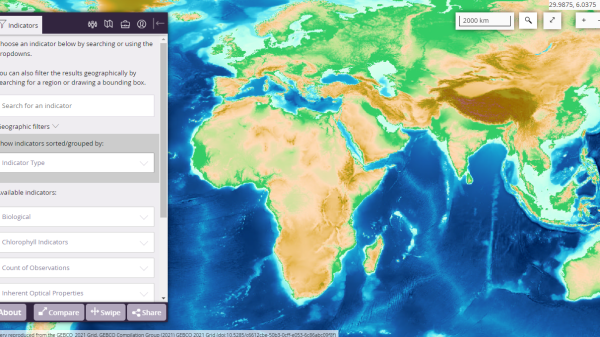
The Ocean Data Viewer allows users to view and download a range of spatial datasets that are helpful for decisions regarding the conservation, management, and restoration of marine and coastal biodiversity. Government agencies, scientists, researchers, the private sector, and non-governmental organizations have used this tool. If users want to analyze the data, they are encouraged to explore and query the spatial data themselves after downloading.
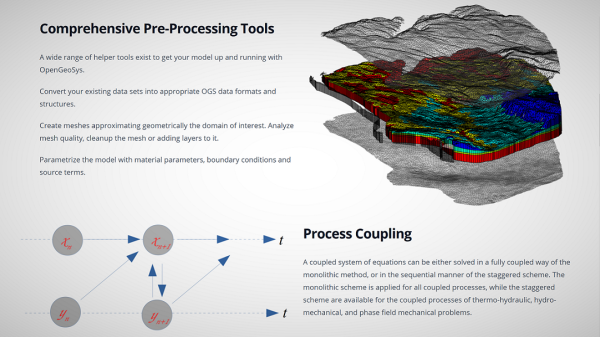
OpenGeoSys developers
OpenGeoSys (OGS) is a scientific open source project for the development of numerical methods for the simulation of thermo-hydro-mechanical-chemical (THMC) processes in porous and fractured media. OGS been successfully applied in the fields of contaminant hydrology, water resources and waste management, geotechnical applications, geothermal energy systems and energy storage.
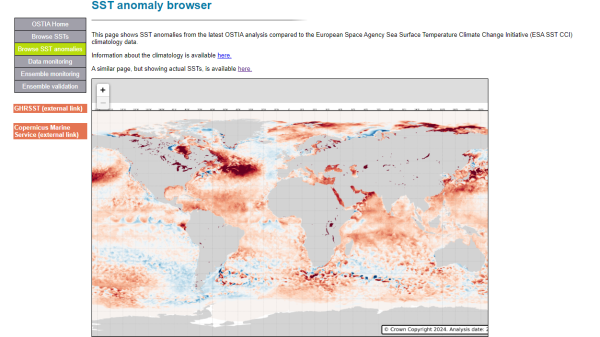
Met Office
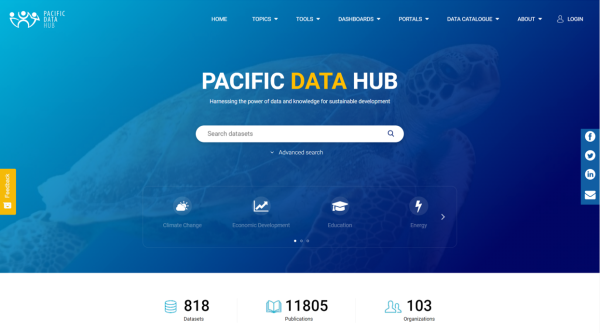
Pacific Community (SPC) and New Zealand Ministry of Foreign Affairs and Trade
The Pacific Data Hub (PDH) aims to provide a comprehensive collection of information about the Pacific, including population statistics, fisheries science, climate change adaptation, disaster risk reduction and resilience, public health surveillance, conservation of plant genetic resources for food security, and human rights. The Pacific Data Hub is an innovative work program led by the Pacific Community (SPC) and supported by the New Zealand Ministry of Foreign Affairs and Trade. Users can search relational data with keywords and through the web-based map.
Pacific Climate Change Portal (PCCP)
The Pacific Ecosystem-based Adaptation Tool helps decision-making for planning on Ecosystem-based Adaptation (EbA) in the Pacific region. Depending on local circumstances, it guides the types of EbA options that may be considered. It utilizes three guiding questions to identify possible EbA options and does not require the input of detailed datasets.
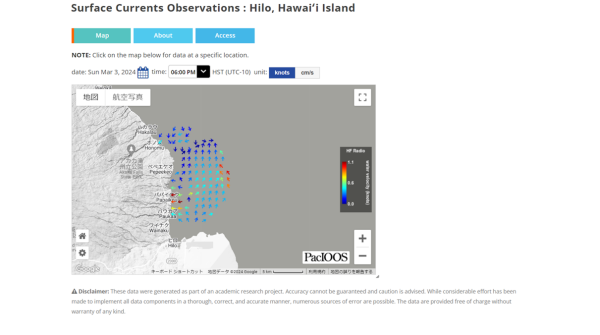
U.S. Integrated Ocean Observing System
The Pacific Islands Ocean Observing System (PacIOOS) collects real-time data on ocean conditions, forecasts future events, and develops user-friendly tools to access this information. In collaboration with an extensive network of partners, PacIOOS helps inform decision-making in Pacific communities daily. The PacIOOS region spans across the U.S. Pacific Islands, including the State of Hawaiʻi (Kauaʻi, Oʻahu, Maui County, Hawaiʻi Island); the territories of Guam, the Commonwealth of the Northern Mariana Islands (CNMI), and American Samoa. Users can visualize the data on the website and download it in several formats, including NetCDF.
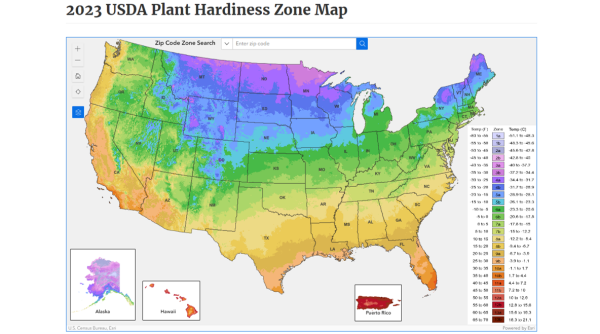
U.S. Department of Agriculture (USDA)
The Plant Hardiness Zone Map helps gardeners and growers determine which perennial plants are most likely to grow in a given location. This web-based map categorizes and color-codes areas by 5 or 10 degrees Fahrenheit based on average annual winter extreme minimum temperatures. Videos also provide information on how to use this map and learn relevant growing knowledge.
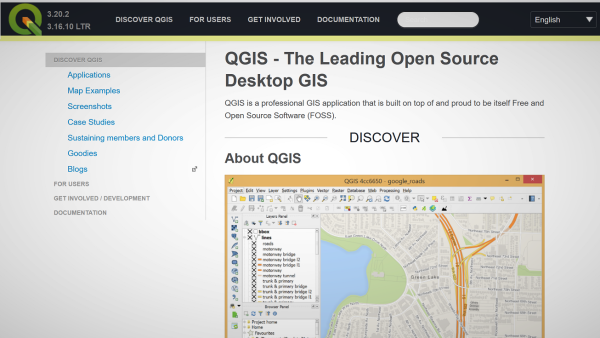
Open Source Geospatial Foundation (OSGeo)
A Free and Open Source Geographic Information System. QGIS is a professional GIS application that is built on top of and proud to be itself Free and Open Source Software (FOSS).
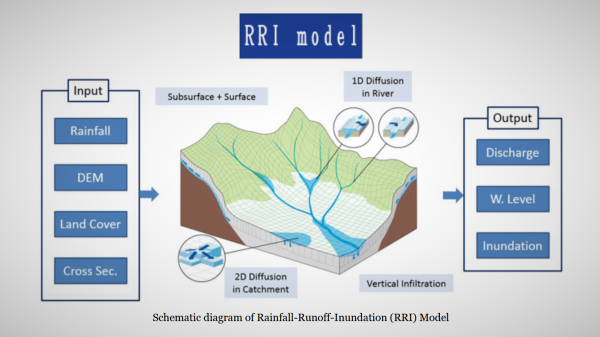
ICHARM The International Centre for Water Hazard and Risk Management under the auspices of UNESCO
RRI model is a two-dimensional model capable of simulating rainfall-runoff and flood inundation simultaneously (Sayama et al., 2012). The main features include: 1. Rainfall-runoff and inundation simultaneously with diffusion wave approximations. 2. Subsurface flow (lateral subsurface and vertical infiltration) is simulated for physical representations of rainfall-runoff processes. 3. One-dimensional diffusive wave river routing and its interaction with the slope model.
École Polytechnique Fédérale de Lausanne (EPFL), National Centre for Scientific Research (CNRS), Frence National Research Institute for Sustainable Development (IRD)
World Resources Institute (WRI)
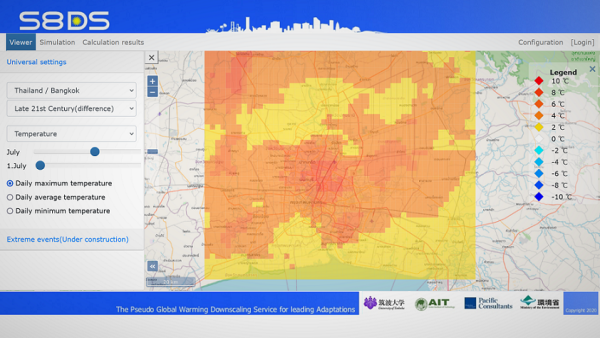
University of Tsukuba, Japan Agency for Marine-Earth Science and Technology (JAMSTEC), Hokkaido University
The S8 SI-CAT Downscaler (S8DS) is a pseudo global warming downscaling service to support climate adaptation efforts. The S8DS service is a user-friendly tool to support governmental personnel in making informed decisions for policies, programs, and projects, by putting the best available research-based evidence at the heart of policy development and implementation.
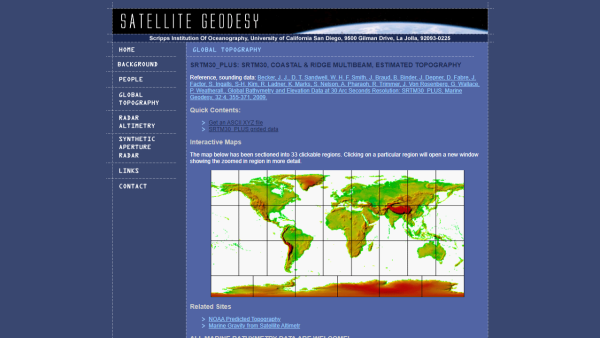
Scripps Institution of Oceanography, University of California San Diego
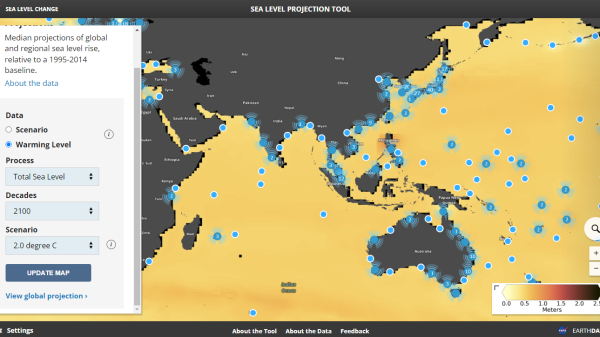
National Aeronautics and Space Administration (NASA), The Intergovernmental Panel on Climate Change (IPCC)
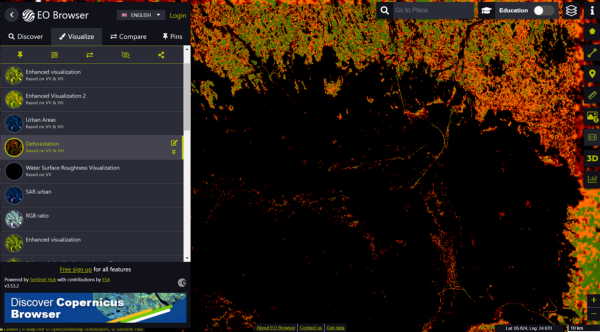
Sinergise
Sentinel Hub offers several free satellite imagery services for non-commercial and media specifications, including Sentinel and Landsat. EO Browser in the hub allows users to visualize, analyze, and download satellite imagery. The satellite services and EO Browser are expected to be used in various fields such as agriculture, land change detection, water resources monitoring, disaster management, use for journalism, media, and the insurance industry, etc.
Senckenberg Biodiversity and Climate Research Centre
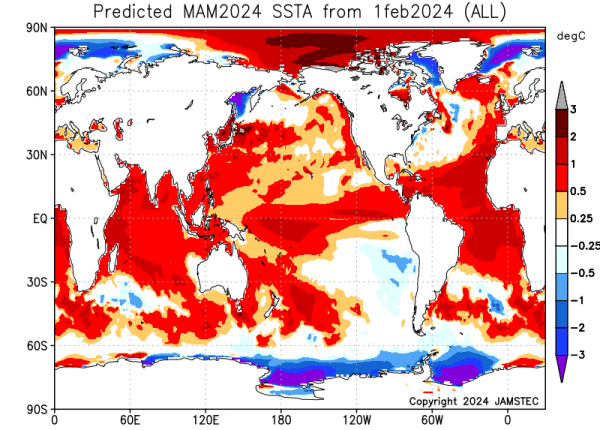
Japan Agency for Marine-Earth Science and Technology (JAMSTEC)
The SINTEX-F1 ocean-atmosphere coupled general circulation model has been developed under the EU-Japan research collaboration. Based on this seasonal prediction system, climate predictions, including tropical climate variations, in particular the IOD, the ENSO, and the ENSO Modoki, have been conducted at least one year ahead. Users can visualize the prediction and download the data in a CSV format on the website.
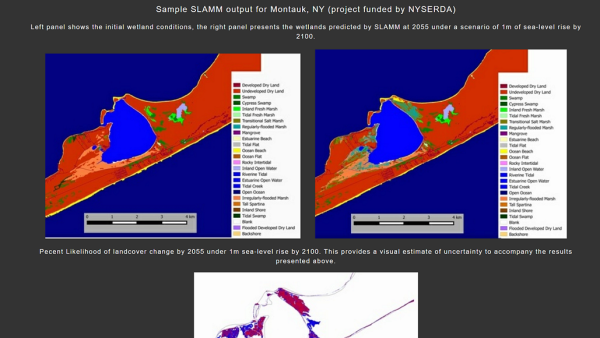
Warren Pinnacle Consulting, Inc.
The Sea Level Affecting Marshes Model (SLAMM) simulates the dominant processes involved in wetland conversions and shoreline modifications during long-term sea level rise. Map distributions of wetlands are predicted under conditions of accelerated sea level rise, and results are summarized in tabular and graphical form. The newest versions of SLAMM include a Roads module to investigate the inundation frequency of road infrastructure and a stochastic uncertainty analysis module for asessing the effects of input data uncertainty on model predictions. The uncertainty analysis module can be used to produce confidence intervals for model predictions and likelihood maps.
Center for Global Environment Research, National Institute for Environmental Studies (NIES)
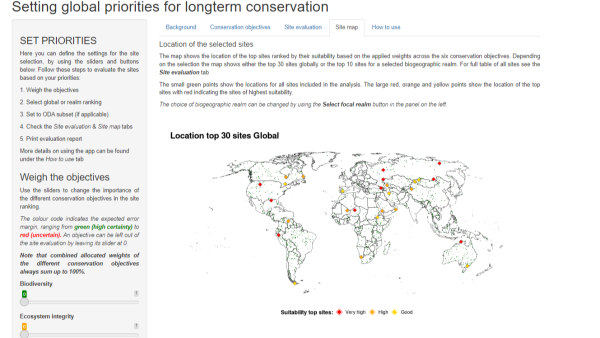
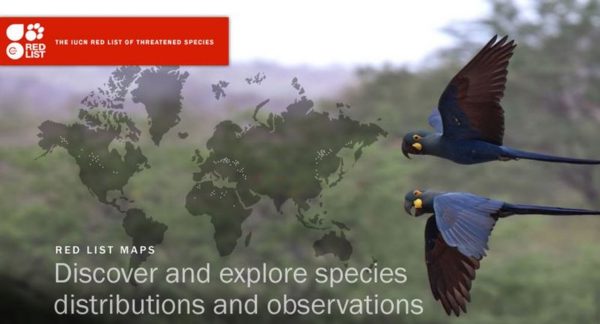
International Union for Conservation of Nature and Natural Resources (IUCN)
The IUCN Red provides a List of Threatened Species, a global assessment of more than 157,100 species. Spatial data, including taxonomic information, distribution status, IUCN Red List Category, sources, and other details about the maps, is prepared for more than 83% of these (>130,500 species). Users can download the data in Esri shapefile format or in CSV format.
Consejo Superior de Investigaciones Científicas (CSIC)
Consejo Superior de Investigaciones Científicas (CSIC)
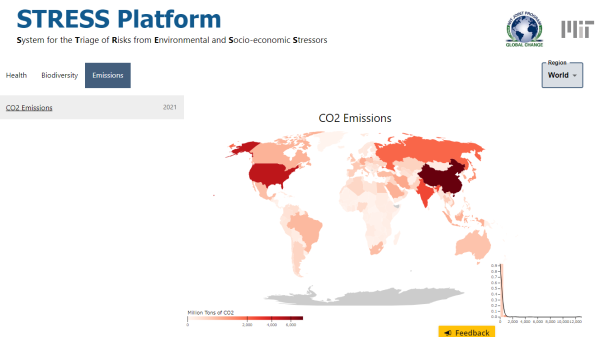
Massachusetts Institute of Technology (MIT)
International Union for Conservation of Nature World Commission on Protected Areas (IUCN WCPA)
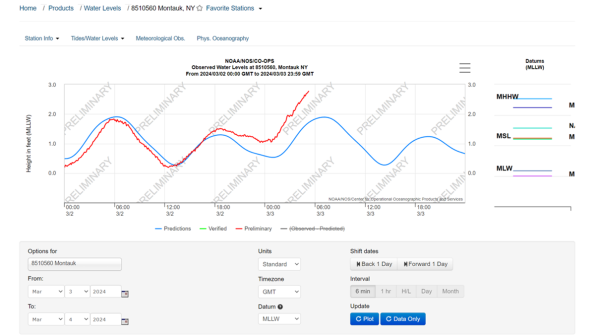
National Oceanic and Atmospheric Administration (NOAA)
NOAA's Tides and Currents website provides tides and water levels, which are the result of the periodic rise and fall of water due to gravitational interactions among the sun, moon, and earth. The websites provide various data, including real-time water level information that is updated every 6 minutes, the tide prediction, the rate of mean sea level rise, etc. Users can acquire data from active or historic stations.
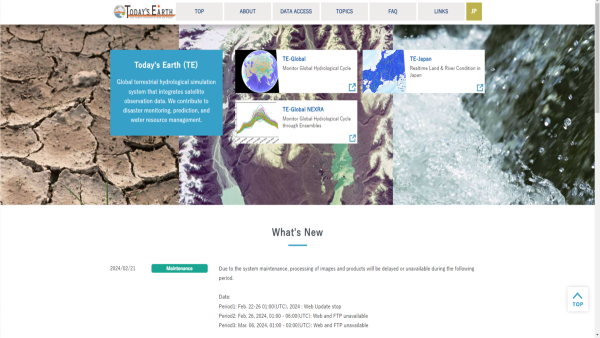
Japan Aerospace Exploration Agency (JAXA)
"Today's Earth (TE)" is JAXA's land surface and river simulation system developed under the joint research with University of Tokyo. The system distributes and visualizes various hydrological products and their magnitudes for disaster monitoring and hydrological research.
Global Center on Adaptation, CARE Climate Justice Center
This tool allows youth to acquire knowledge for participating in adaptation policy processes and practicing adaptation. The tool consists of eight modules, ranging from understanding climate change to designing adaptation actions. Each module is accompanied by videos and infographics, and the last section of each module includes a quiz to test your understanding of the content. The content of each module can be downloaded in PDF format.
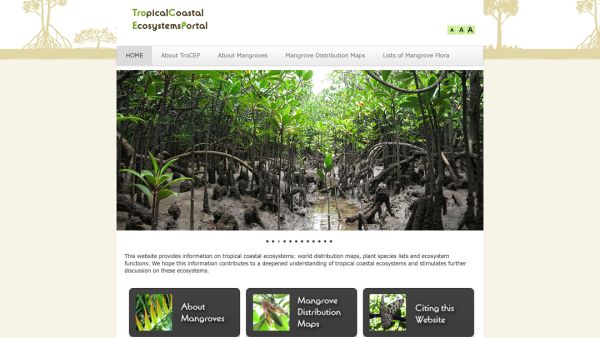
National Institute for Environmental Studies (NIES), International Society for Mangrove Ecosystems (ISME)
TroCEP is a portal that provides information on tropical coastal ecosystems: world distribution maps, plant species lists and ecosystem functions, especially related to the global distribution of mangroves. This information contributes to a deepened understanding of tropical coastal ecosystems and stimulates further discussion on these ecosystems.
United Nations Environment Programme (UNEP)
Stockholm Environment Institute (SEI)
WEAP ("Water Evaluation And Planning" system) is a software tool for water resources planning. It helps make plans for allocating limited water resources between agricultural, municipal, and environmental uses, considering the integration of supply, demand, water quality, and ecological considerations. Its map-based graphical interface facilitates the analysis of models and visualization of the results. To use the tool, users must create an account and download the software.
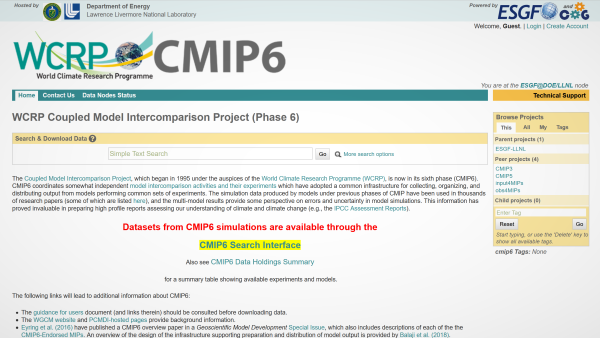
World Climate Research Programme (WCRP), The Earth System Grid Federation (ESGF)
The Coupled Model Intercomparison Project (CMIP) coordinates the design and distribution of global climate model simulations of the past, current and future climate. CMIP is conducted under the auspices of the World Climate Research Programme (WCRP), and is now at its 6th phase (CMIP6). It provides invaluable simulation data for better understanding of climate and climate change. You can access datasets from CMIP6 simulations through the CMIP6 Search Interface, and additional information about CMIP6 is available via other sources linked on the WCRP CMIP6 website. The complete archive of CMIP6 output is available for search and download via any of four portals listed on the WCRP CMIP6 website [(USA, PCMDI/LLNL), (France, IPSL), (Germany, DKRZ), (UK, CEDA)]
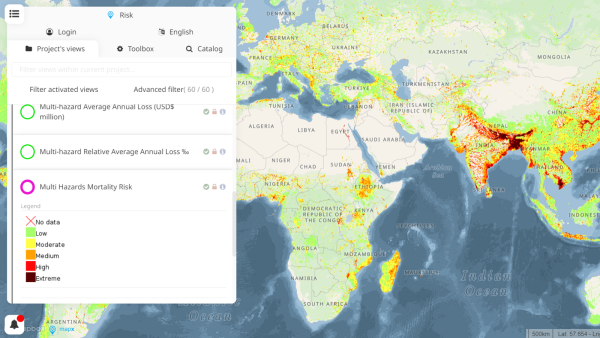
UNEP GRID Geneva
This tool visualizes the situation and risk of disasters such as fires, earthquakes, volcanic eruptions, tsunamis, floods, landslides, and tropical cyclones. For the items “floods” and “tropical cyclones,” it is possible to display the past occurrence of each disaster and the risk of recurrence over a 1000-year period on a map. You can also visualize the annual loss amount and mortality risk due to multi-hazards. Images showing disaster situations and risk data can be downloaded.
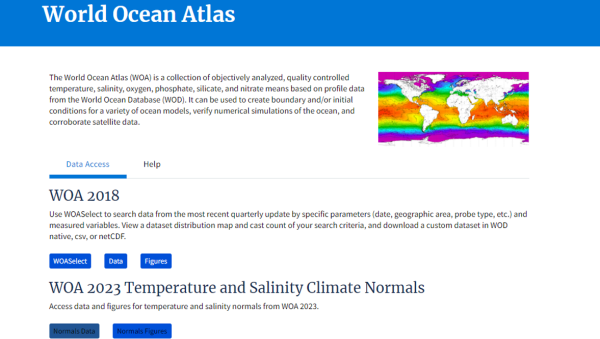
National Centers for Environmental Information (NCEI) at National Oceanic and Atmospheric Administration (NOAA)
The World Ocean Database (WOA) is a database of temperature, salinity, oxygen, phosphate, silicate, and nitrate, maintained with uniform quality standards, using data from NOAA's World Ocean Database (WOD). It is envisioned that the data will be used, for example, to build ocean models and validate numerical simulations of the ocean. Multi-year data (1994, 1998, 2001, 2005, 2009, 2013, 2018, 2023) between 1994 and 2023 are available. It is possible to download the data in file formats such as CSV and NetCDF.
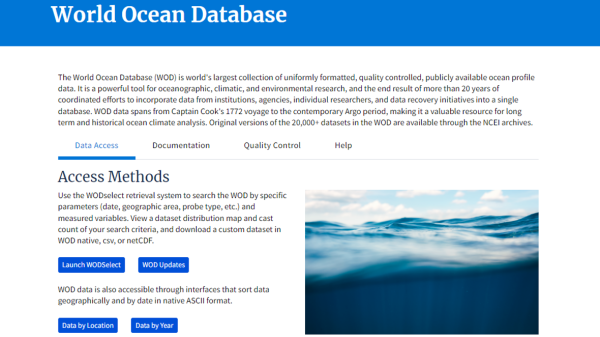
National Centers for Environmental Information (NCEI) at National Oceanic and Atmospheric Administration (NOAA)
The World Ocean Database (WOD) is the world's largest publicly available database of quality-controlled oceanographic data in a uniform format. It is intended to be used for ocean, climate, and environmental research, etc., by accumulating data on various variables such as temperature, salinity, oxygen, and biological variables (plankton, chlorophyll, etc.) from as far back as the 1700s to the present day. Using the search system, you can search by specific parameters (date, geographic region, etc.) or by variable type. It is possible to download the data in file formats such as CSV and NetCDF.
Steering Committee of WoRMS
A World Register of Marine Species (WoRMS) aims to provide a comprehensive list of names of marine organisms. Taxonomic and thematic experts control the content of WoRMS. WoRMS has an editorial management system where each taxonomic group is represented by an expert who has authority over the content and is responsible for controlling the quality of the information. Users can use the WoRMS Taxon Match Tool to automatically match users' species list or taxon list with the WoRMS database. After matching, the tool will return users' files with the IDs, valid names, authorities, WoRMS classification, and/or any other output you selected.
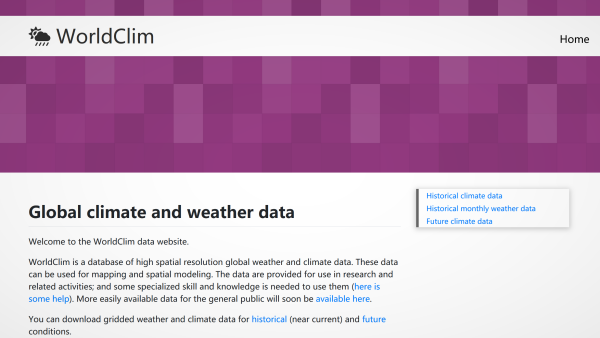
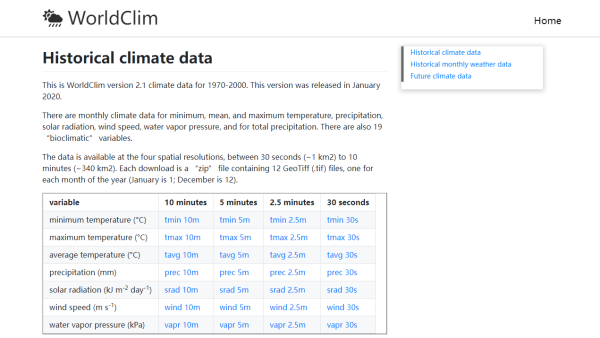
University of California
WorldClim is a database of high spatial resolution global weather and climate data. These data can be used for mapping and spatial modeling. The data are provided for use in research and related activities, and some specialized skill and knowledge is needed to use them. You can download gridded weather and climate data for historical (near current) and future conditions.
worldclim.org
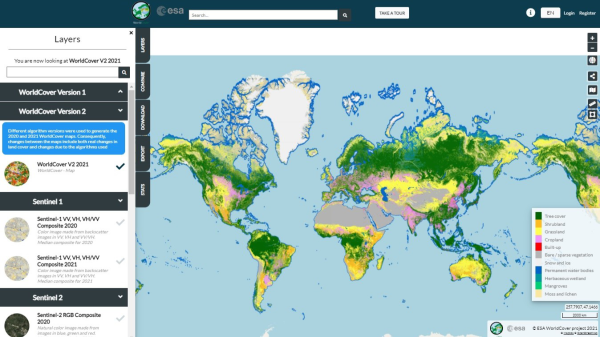
European Space Agency (ESA)