Ecosystem Functions Potential Maps
ABOUT THIS ISSUE
Ecosystem functions are rarely considered in conventional land-use planning because they have multiple benefits that are difficult to translate into policies
SOLUTION
Evaluating and visualising ecosystem functions using Ecosystem Functions Potential Maps enable ecological-friendly land-use planning
Assessment of ecosystem functions are difficult to translate into land-use planning
Nature-based Solutions (NbS) consider the various functions of ecosystems and aim to use them to solve social problems. However, it is difficult to evaluate the functions of ecosystems at the outset, because they are unique to each region depending on the land use situation. Furthermore, ecosystems have multiple benefits. In the case of disaster risk reduction, hazard maps are widely used for land use planning. It is partly because hazard maps on a single benefit – disaster risk reduction. The question is whether it would be possible to create a tool similar to a hazard map for ecosystem functions.
Promote the utilisation of ecosystem functions by visualising them
One promising idea is that if various benefits obtained from ecosystems can be carefully selected and visualised on maps, they have the potential to be translated into actual policy designs. Indeed, there has been a lot of discussion on how to represent the functions of ecosystems on maps. Building on such research experience, the Ecosystem Functions Potential Maps are now under development by the Ministry of the Environment, Japan. MOEJ is working to evaluate the function of ecosystems at scales such as watershed scale and municipal scale, depending on the objectives of these maps as well as the available data set. The maps try to capture both current ecosystem functions and potential ecosystem functions which are expected to be activated by making some interventions – as such, they are “potential” maps. At present, the Ecosystem Functions Potential Maps are still in the study stage and leading experts in the field of Eco-DRR and climate change adaptation are discussing some key hurdles to making the maps a reality, including evaluation methodology and possible implementation strategies. This article is based upon current discussions concerning the Ecosystem Functions Potential Maps.
Experimenting with visualisation in wetlands and floodplains
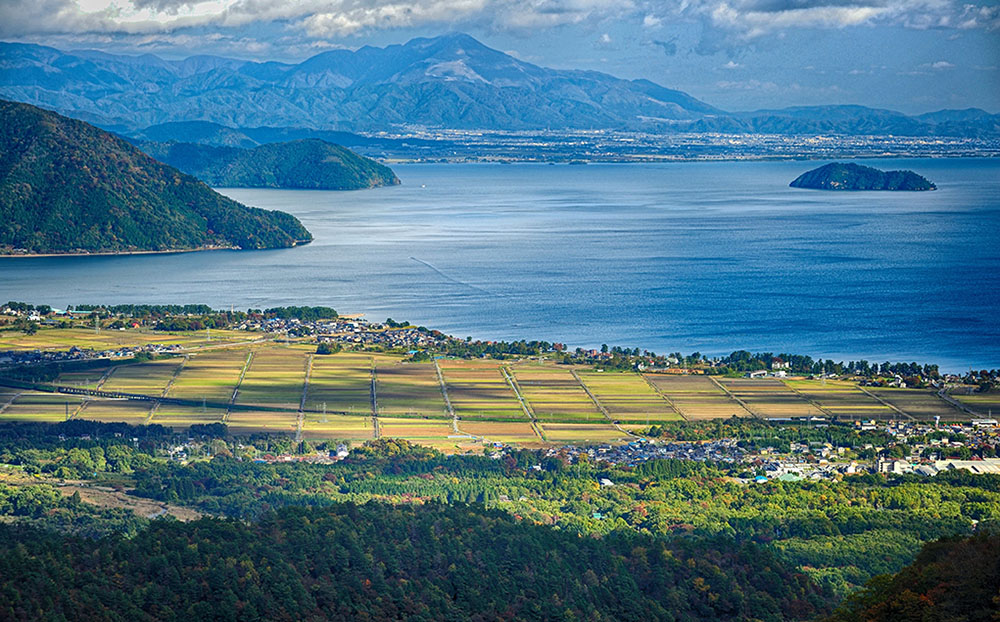
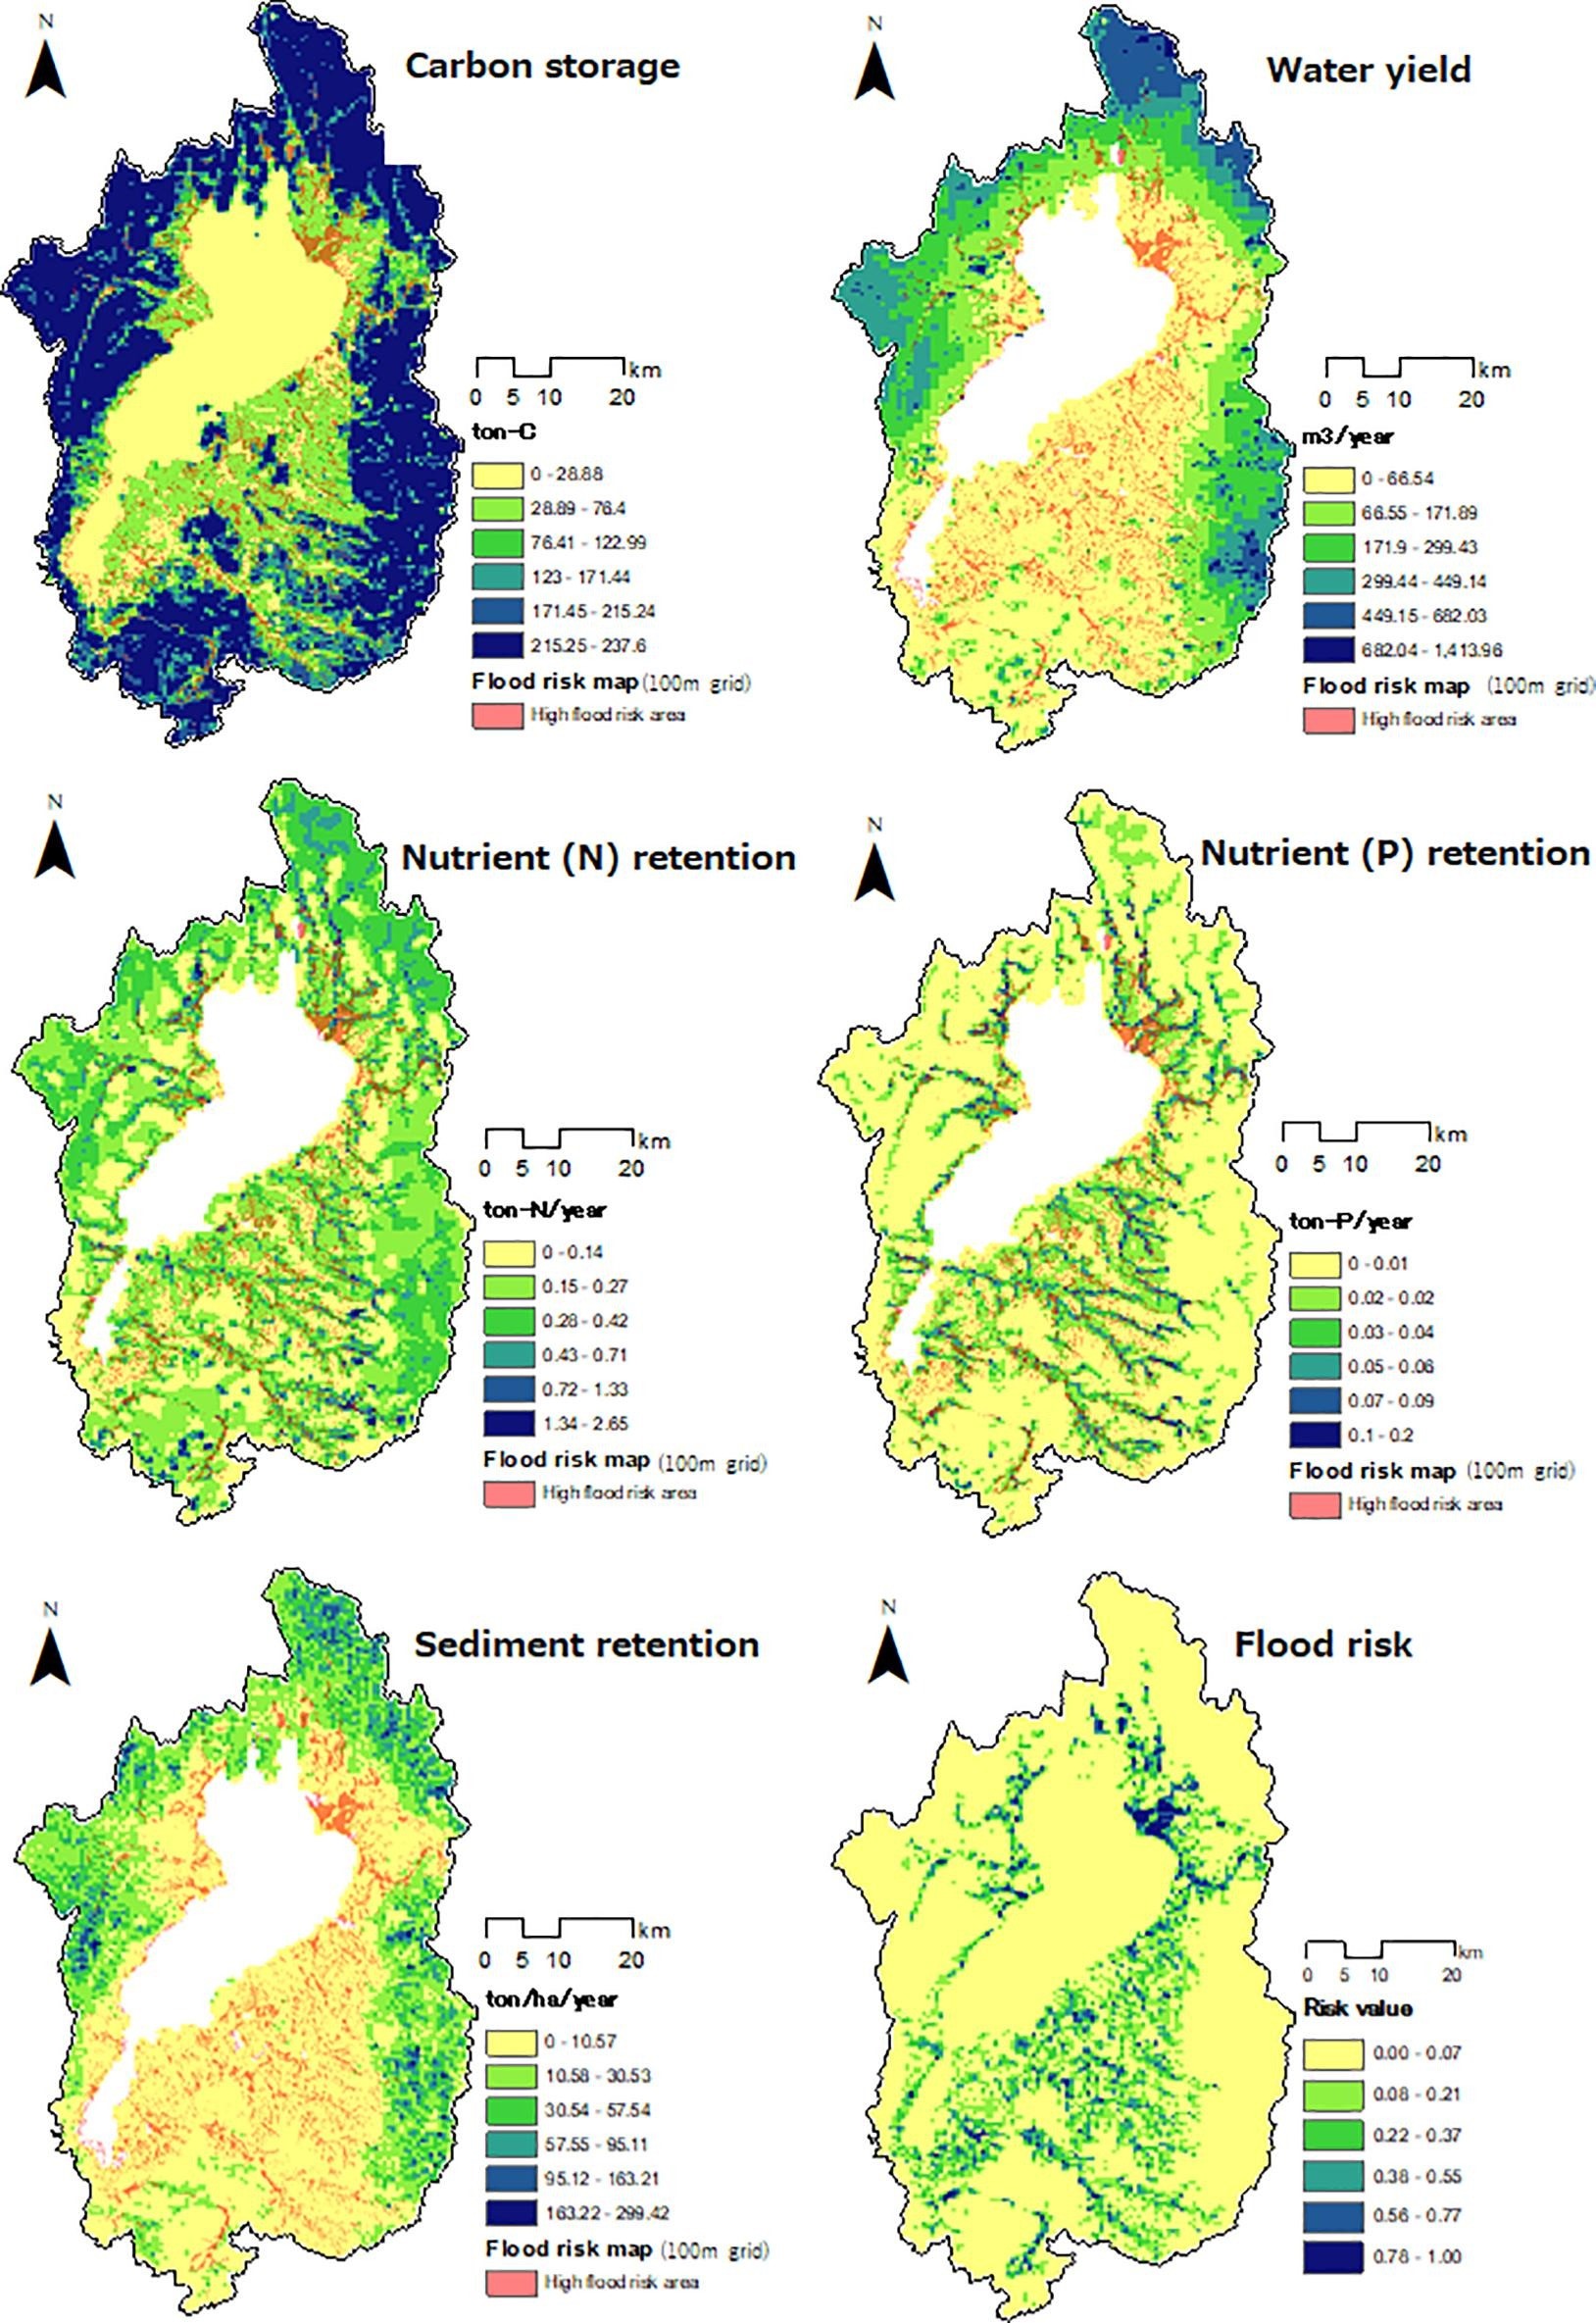
As discussed above, there are a wide range of ecosystem functions, but it is difficult to incorporate such diverse benefits comprehensively into maps. As shown in the above figure, there are a number of maps that could be put together to present ecosystem functions. When these maps are too complicated with too many different ecosystem functions being presented, they are less useful for policy purposes. Depending on the purpose of the map, we need to prepare maps with a certain degree of simplification. For example, one method that has been proposed and experimented so far is to evaluate just two elements: a biodiversity conservation function and a disaster risk reduction function against flooding. It has been tested with wetlands and floodplains in Japan, such as Inbanuma, Chiba prefecture. Wetlands and floodplains have a potential biodiversity conservation function and a disaster risks reduction function, among others, but these functions have not been captured well under the existing framework of land-use management. The proposed approach will help to improve visualisation by bringing together a biodiversity conservation function and a disaster risk reduction.
The process to generate maps is as follows. The first step is to select which functions to measure. Let’s say we pick the two functions of ecosystem conservation and disaster risk reduction. We would then identify existing indexes and data to be visualised. In this case, the Topographic Wetness Index (TWI), a geomorphic index showing the ease of water accumulation, is used to quantify the function of wetlands and floodplains as habitats for plants and animals that depend on them. For the disaster risk reduction function, Japan already has flood forecast area maps. Next, by superimposing the TWI on the flood forecast area map, we can identify areas of high potential with multiple functions in wetlands and floodplains. In the current case, maps help to identify where the ecological functions of former wetlands and floodplains can be also useful for disaster risk reduction. In this way, wetlands and floodplains, the significance of which has been difficult to assess without the help of proper maps, can be positively evaluated from multiple perspectives, and their potential as Eco-DRR can be recognised. Such information will be helpful for land-use planning that is in harmony with nature and resilient to disasters. Moreover, by tracking the record of changing evaluation data of ecosystem potentials in certain areas, it can help to monitor the change of ecosystem functions overtime. For instance, we can do an effective before-and-after comparison of when a major disaster hits a certain area, or carry out an evaluation of policy intervention to realise the higher potential of ecosystem functions in certain areas.
Issues to be addressed in promoting the use of Ecosystem Functions Potential Maps
These potential maps are expected to be published with guidance for local governments in a few years. According to Prof. Kentaro Taki, the University of Shiga Prefecture, it would be of great policy significance if a comprehensive assessment of ecosystem functions could be conducted at the administrative level, because it can lead to economic incentives to invest there. However, technically speaking, it is not difficult to select which functions are to be visualized or not. With the economic incentives that the maps may bring in, such a selection can have a significant impact for local nature and livelihood. Therefore, the decision makers need to have a good knowledge for such policy implications and to determine which functions are appropriate to be visualized. They need to communicate with relevant stakeholders when determining which functions need to be evaluated and visualized onto maps.
In addition, coordination and collaboration among multiple sectors and relevant stakeholders is important to make the most out of ecosystem functions. At the local level, policies to integrate multiple sectors can be easier to implement than at the national level, so good practices in the use of Ecosystem Functions Potential Maps may emerge from the local level. In this regard, the role of the national government will be to promote those efforts at local level by providing knowledge base and necessary technical advice. Since these maps mostly utilize the data relatively easy to obtain, developing countries also have a good chance to use them.
Acknowledgement
This article is indebted from the interview with Prof. Kentaro Taki, the University of Shiga Prefecture on 21 December 2021.